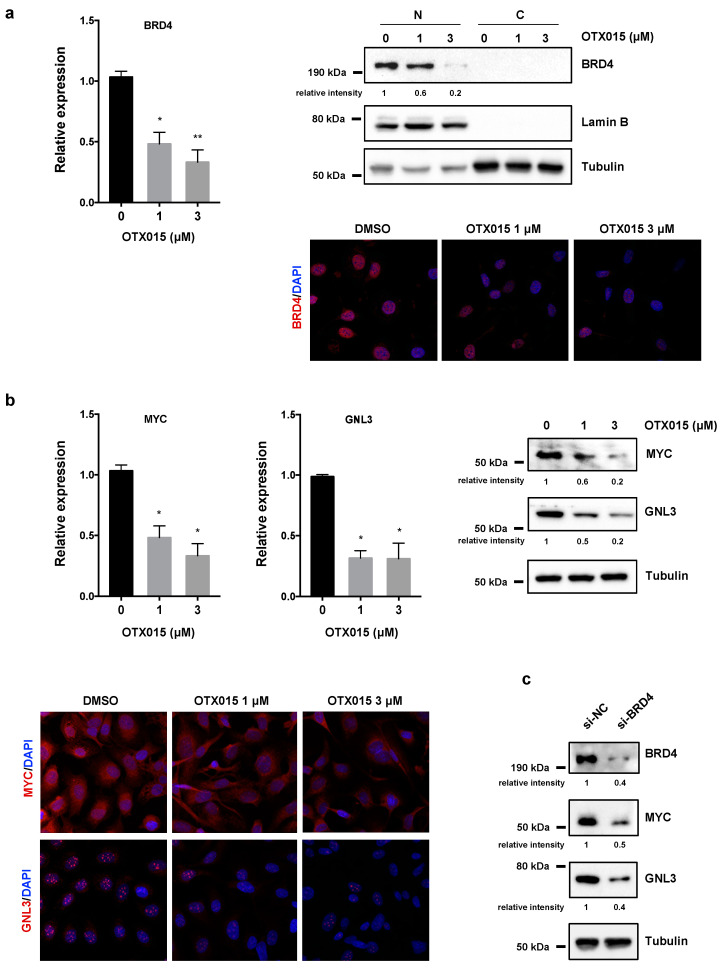
Figure 4.
Effects of OTX015 on BRD4, MYC and GNL3 expression in OC cells. (a) Experiments of q-PCR (left panel) showing BRD4 mRNA levels in OTX015-exposed SKOV3 cells (0–1–3 μM), expressed as fold change relative to control cells, set at 1. β-actin mRNA was used as endogenous control. Histograms indicate mean values ± SD of two independent experiments, each performed in triplicate. Statistical significances were calculated by one-way ANOVA (* p < 0.05; ** p < 0.01). WB analysis (upper right panel) performed on nuclear (N) and cytoplasmic (C) protein extracts from OTX015-exposed SKOV3 cells (0–1–3 μM) for 72 h. Lamin B served to normalize nuclear fraction, whilst tubulin was used for the cytoplasmic fraction. IF experiments (lower right panel) showing the reduction of BRD4 nuclear staining (red) in OTX015 treated (1 μM and 3 μM) cells respect to DMSO controls. DAPI (blue) for nuclear staining. Representative images captured under ApoTome microscope at 40× magnification. (b) q-PCR analysis (left panel) of MYC and GNL3 expression in OTX015-exposed SKOV3 cells (0–1–3 μM), each expressed as fold change relative to mocked control cells, set at 1. β-actin mRNA was used as endogenous control. Histograms indicate mean values ± SD of two independent experiments, each performed in triplicate. Statistical significances were calculated by one-way ANOVA (* p < 0.05 vs. mocked control). WB analysis (right panel) performed on total protein extracts from SKOV3 cells treated with OTX015 (0–1–3 μM) for 72 h. Tubulin served as loading control and representative blot was shown. IF experiments (lower left panel) showing the downregulation of MYC expression and the lower intensity of GNL3 nucleolar foci in OTX015 treated (1 μM and 3 μM) cells in comparison to DMSO controls. (c) WB analysis of BRD4, MYC and GNL3 proteins performed on total protein extracts from SKOV3 cells transfected for 72 h with BRD4 siRNAs (si-BRD4) or negative control molecules (si-NC). Tubulin served as loading control and representative blot was shown. The original Western Blot images can be found in Figure S4.

