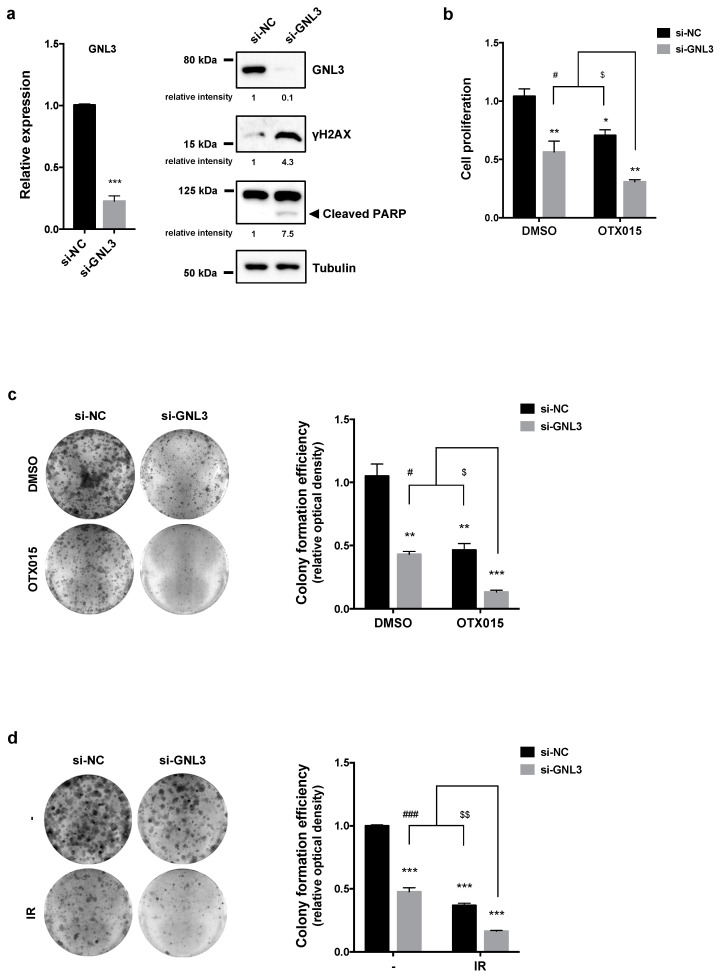
Figure 6.
Effects of GNL3 knocking down in OC cells. (a) q-PCR analysis (left panel) of GNL3 transcript levels in SKOV3 cells transfected for 72 h with GNL3 siRNAs (si-GNL3), expressed as fold change over mocked control cells (si-NC), set at 1. β-actin mRNA was used as endogenous control. WB analysis (right panel) of GNL3, γH2AX and PARP proteins performed on SKOV3 cells transfected for 72 h with GNL3 siRNAs (si-GNL3) or negative control molecules (si-NC). Tubulin was used as loading control and representative blot was shown. (b) Cell proliferation, evaluated by trypan blue exclusion dye in SKOV3 cells transfected with or without si-GNL3 and exposed to 1 μM OTX015, was expressed as fold change respect to si-NC/DMSO sample, set at 1. Results represent mean values ± SD of two independent experiments. Statistical significances were calculated by two-way ANOVA: * p < 0.05, ** p < 0.01; *** p < 0.001 vs. si-NC/DMSO; # p < 0.05 vs. si-GNL3/DMSO; $ p < 0.05 vs. si-NC/OTX015. (c) Clonogenic assays after 12 days of culture in SKOV3 cells transfected with or without si-GNL3 and treated with 1 μM OTX015. Representative images of colonies marked with crystal violet and colony formation efficiency obtained by crystal violet absorbance. Experiments were carried out twice, each in triplicate. Histograms are means ± SD. Statistical significances were calculated by two-way ANOVA: ** p < 0.01, *** p < 0.001, vs. si-NC/DMSO; # p < 0.05 vs. si-GNL3/DMSO; $ p < 0.05 vs. si-NC/OTX015. (d) Four h after IR, si-NC and si-GNL3 transfected SKOV3 cells were plated at low concentration and cultured for 12 days. Representative images of colonies marked with crystal violet, from two independent experiments, each performed in triplicate. Bar represents the means ± SD of the crystal violet absorbance. Statistical analyses were calculated by using two-way ANOVA: *** p < 0.001, vs. si-NC/no IR; ### p < 0.001 vs. si-GNL3/no IR; $$ p < 0.01 vs. si-NC/IR. The original Western Blot images can be found in Figure S4.

