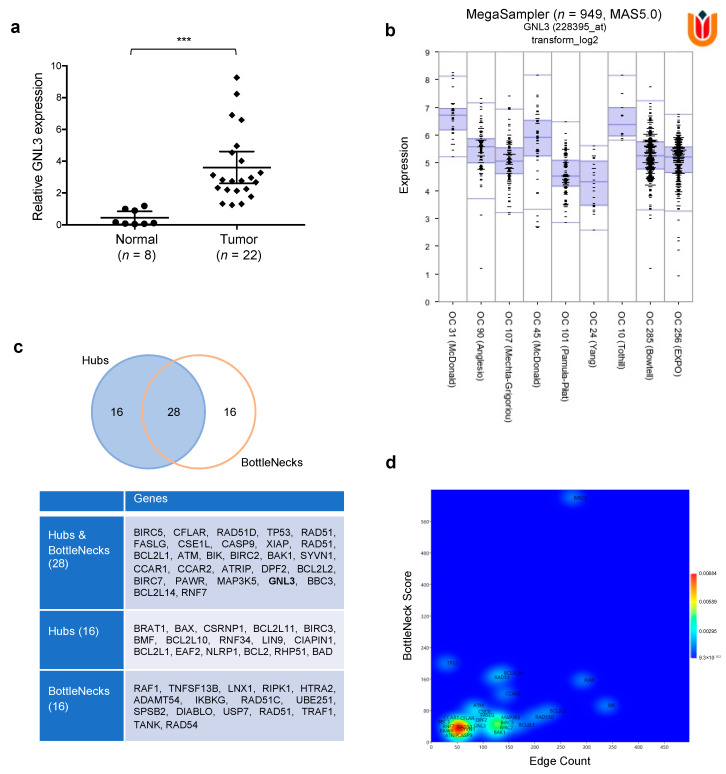
Figure 7.
Biological significance of GNL3 expression in OC tumorigenesis. (a) GNL3 mRNA expression was assessed in 22 OC tumor biopsies and 8 non-tumoral ovarian tissues by q-PCR assays (*** p < 0.001). (b) Using ‘R2: Genomics Analysis and Visualization Platform (http://r2.amc.nl (accessed on 20 December 2020)), the expression of GNL3 gene was assessed in 9 different databases referred to different Ovarian Cancers, and it results always overexpressed, n = 949, p = 2.2 × 10−43 (c) The nodes acting as controller within the network are identified and classified as Hubs and BottleNecks, Hubs, or BottleNecks depending on their node degree and BottleNeck score. (d) A 2D Kernel Density Estimation (2D-KDE), Gaussian model, was carried out on Hubs and BottleNecks based on their node degree (x-axis) and BottleNecks score (y-axis).

