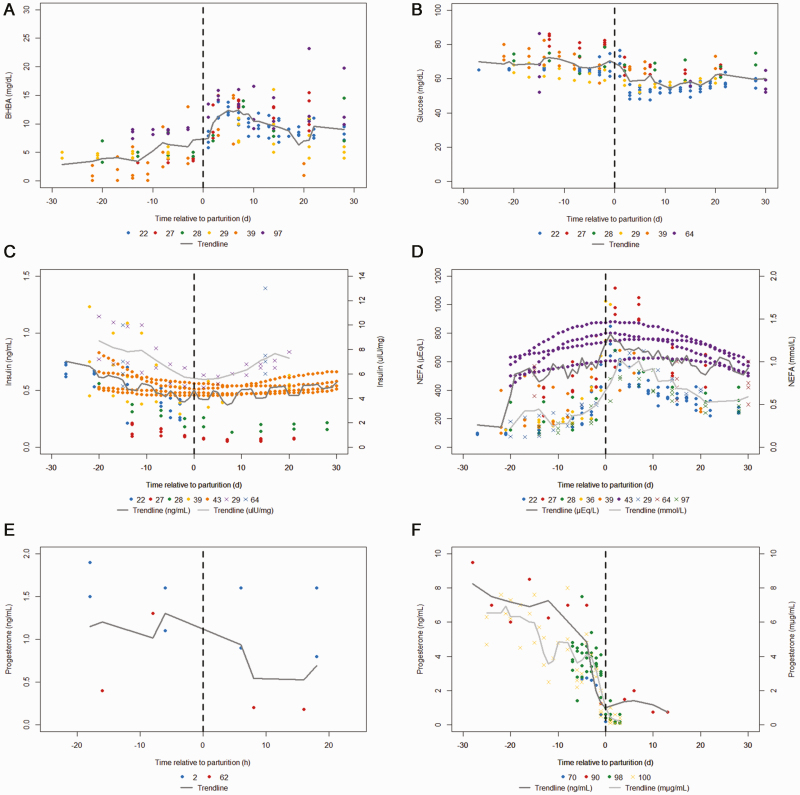
Figure 3.
Long- and short-term temporal graphs generated for (a) β-hydroxybutyric acid (BHBA) (long-term), (b) glucose (long-term), (c) insulin (long-term), (d) non-esterified fatty acids (NEFA) (long-term), (e) progesterone (short-term), (f) progesterone (long-term), (g) dry matter intake (short-term), (h) dry matter intake (long-term), (i) drinking duration (short-term), (j) drinking duration (long-term), (k) feeding duration (short-term), (l) feeding duration (long-term), (m) calf licking (short-term), (n) calf licking (long-term), (o) lying bouts (short-term), (p) lying bouts (long-term), (q) lying duration (short-term), (r) lying duration (long-term), (s) rumination duration (short-term), (t) rumination duration (long-term), (u) standing duration (short-term), and (v) standing duration (long-term). Graphs for short-term assessments had time ranges from the day prior to and following parturition, although long-term graphs include a 30 d period from before and after calving. A secondary axis was generated where there was more than one unit of measurement used. Data associated with the secondary axis are depicted with a cross marker, as opposed to the circle marker for data corresponding to the primary axis. Thick grey lines depict the rolling average trendline, and darker grey thick lines correspond to the secondary axis. Crosses used for graphing the short-term calf licking pattern refer to the time taken for the cow to initiate licking after birth. These data were excluded from the trendline analysis. Numbers in the legend coincide with a reference, as listed in Supplementary Table S1.

