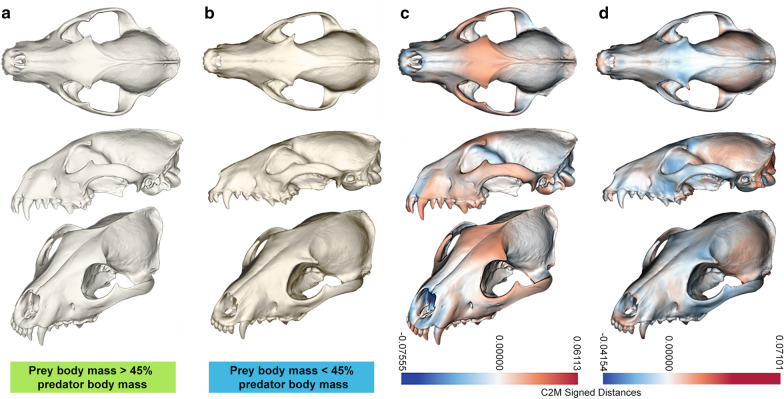
Fig. 4.
Mean cranial shape of large- and small-prey predators. a Large-prey (> 45% of predator body mass) mean shape and b small-prey (< 45% of predator mass) mean shape cranial meshes were generated by thin-plate spline warping of the mean cranial shape. Euclidean distances between the meshes of the c large-prey and d small-prey mean shapes and the total mean cranium shape are shown as deviation from the mean shape expressed by colour (blue–white–red). Blues show constriction relative to the mean shape, reds show expansion, with white as approximately congruent to the mean shape

