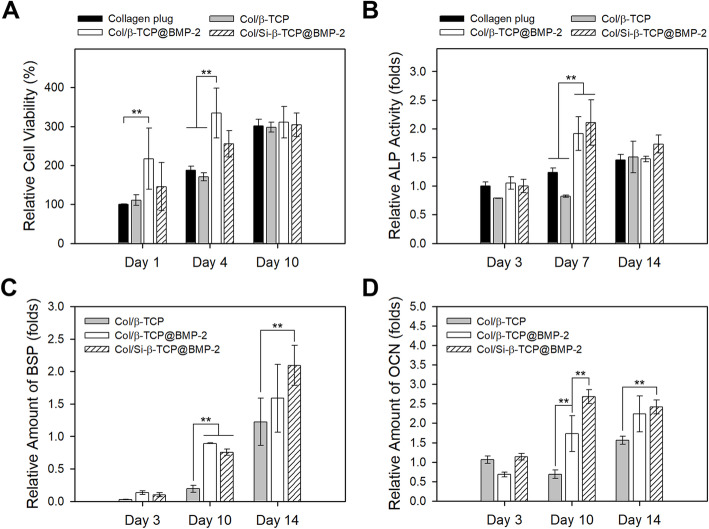
Fig. 2.
In vitro osteogenic behaviors of pre-osteoblasts on the bone-graft surfaces. a Cell counts at 1, 4 and 10 days post-seeding measured by MTS assay. b ALP activity at 3, 7 and 14 days after induction of differentiation. The relative ALP activity values per each cell were obtained by normalizing to the initial value (for Day 3) of the collagen plug (negative control). The expressions of (c) BSP and (d) OCN at 3, 10 and 14 days after induction of differentiation. The relative gene expression levels were obtained as the mean fold over the value for the collagen plug (negative control) at the corresponding time points. The data represent the mean ± standard deviation with statistical significance (**p < 0.01)

