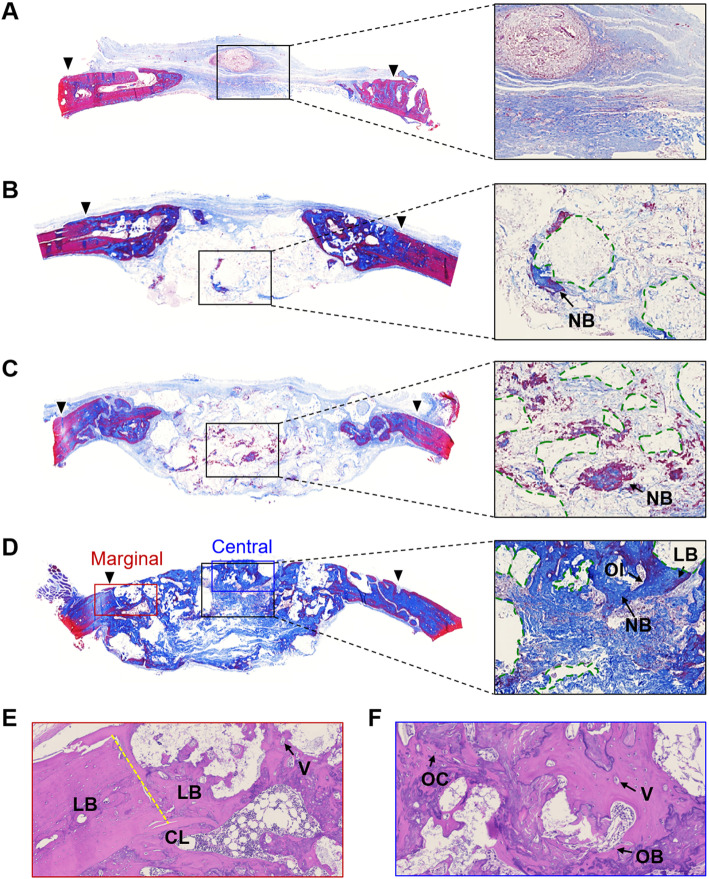
Fig. 4.
Histological analyses of bone regeneration in a rat calvarial defect at 8 weeks post-surgery. Images of MT-stained sections for (a) the bare collagen group, (b) the Col/β-TCP group, c the Col/β-TCP@BMP-2 group and (d) the Col/Si-β-TCP@BMP-2 group. The black triangles indicate the marginal defect point, the black boxes indicate sections to be magnified for central regions of the defect, and the green dotted lines indicate the space occupied by bone graft particles. The red and blue boxes in (d) indicate the marginal and central regions of the defect, respectively, in the Col/Si-β-TCP@BMP-2 group to be magnified as H&E-stained images. Images of H&E-stained sections for (e) the marginal and (f) the central regions in the Col/Si-β-TCP@BMP-2 group. The yellow dotted lines indicate the marginal boundary of the bone defect. Abbreviations: NB, newly formed bone; LB, lamellar bone; OI, osteoid; CL, cutting line; V, vessel; OB, osteoblast; OC, osteocyte

