Fig. 1.
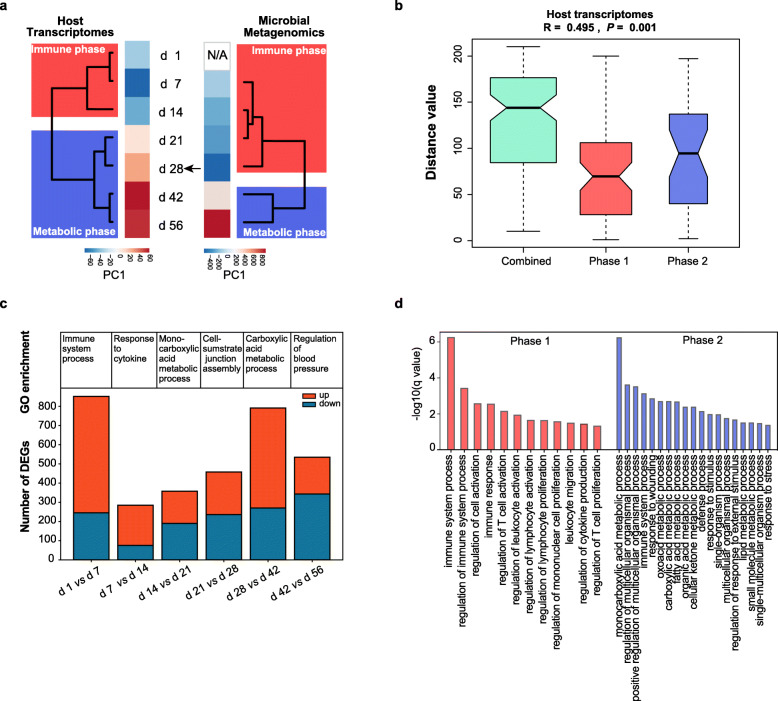
Developmental dynamics revealed by the rumen transcriptome. a From the host rumen transcriptome, two stages were identified that transition earlier than the microbial gene abundance of metagenomics by PC1 of PCA analysis and unsupervised hierarchical clustering analysis. The black arrow represented the granulated feed has been added at d 25. b ANOSIM test of rumen transcriptomes between the two phases. If the median line of the “combined” group (including data for samples collected during both Phase 1 and Phase 2) was higher than the median lines for the two separate phases, the grouping was considered reasonable, and if the R value was greater than 0, there was a significant difference between the groups. In contrast, an R value less than 0 indicated that the difference within groups was greater than that between groups. c Barplots showing the numbers of upregulated DEGs (colored in orange) and downregulated DEGs (colored in blue) between every two time-points. d GO analysis of rumen DEGs during the first phase (colored in orange) and the second phase (colored in blue). Only terms with Bonferroni-adjusted P < 0.05 were considered

