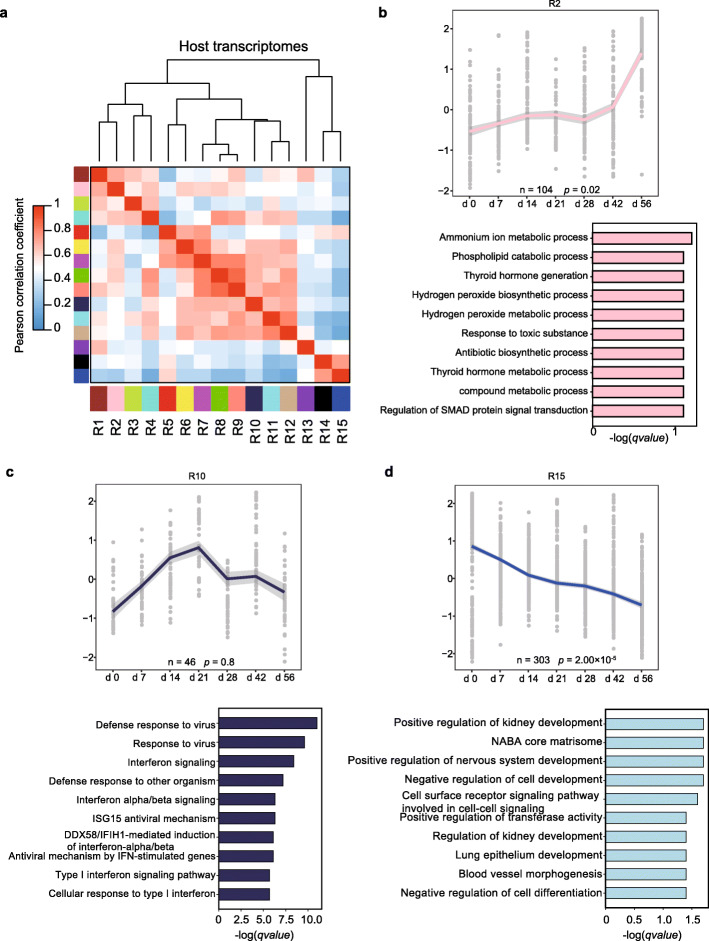
Fig. 2.
WGCNA of postnatal rumen development transcriptomes. a Relationship of gene modules among gene expression of DEGs between each pair of time-points (modules are named by colors). b Gene expression modules (R2) showed up-regulation during the early development of the rumen. The barplots indicate the enriched gene ontology terms. c Gene expression modules (R10) showed increasing during the immune phase and decreasing during the metabolic phase. d Gene expression modules (R15) showed declining during the early rumen development. In each module, n indicates the number of genes in the module. The expression regression line was generated using the Loess curve-fitting method, and P values indicate the significance of Spearman’s rank correlation coefficient between the eigengene and age. The eigengene is a central gene whose expression pattern can represent the whole module

