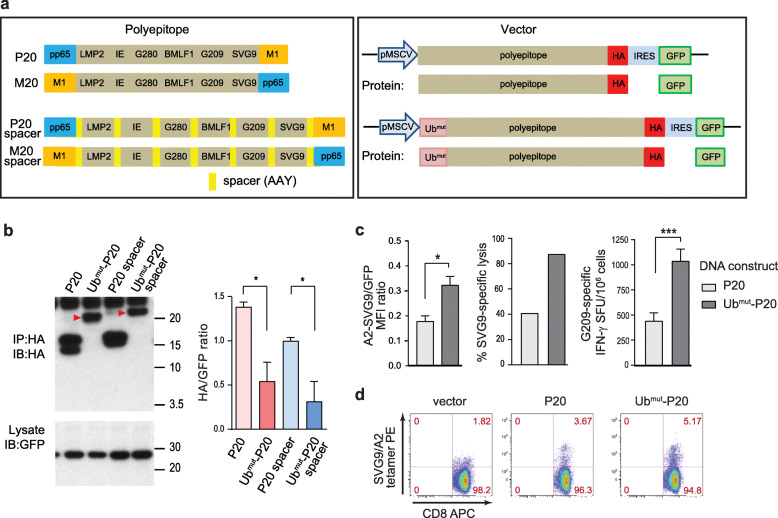
Fig. 1.
Optimizing the polyepitope DNA vaccine design. a Schematic DNA constructs encoding eight polyepitope model antigens (peptide sequences were listed in Additional file 2, Table S1). Left, polyepitope P20 and M20 differ only in the position of epitopes pp65 and M1. Right, the polyepitope constructs were subcloned into a retroviral vector driven by the MSCV promoter. The HA-tag and IRES-GFP were included to facilitate the in vitro detection of polyepitope protein production. Ubmut, a mutated (G76V) ubiquitin. b Immunoblot (IB) analysis of the polyepitope proteins. Left, HeLa-A2 cells were transduced with indicated polyepitope constructs. Red arrowheads indicate the ubiquitinated polyepitope proteins. Right, HA/GFP ratio was used to quantify relative levels of polyepitope proteins. Results combined from three independent experiments (mean ± SEM) were shown. c Presentation of antigens by the transduced HeLa-A2 cells. Left, surface staining of the SVG9/HLA-A2 complexes with a TCR-mimic antibody. Mean fluorescence intensity (MFI) of the SVG9/HLA-A2 signal relative to MFI of the co-expressed GFP (mean ± SEM, in triplicates) was shown. Middle, specific lysis of transduced HeLa-A2 cells by SVG9-specific cytotoxic T cells was measured by a 51Cr-releasing cytotoxicity assay (E:T = 25:1). Right, DNA vaccines induced G209-specific immune response in HHD II mice was measured by an IFN-γ ELISpot assay (mean ± SEM, n = 8). These experiments were repeated at least once and representative results were shown. d Representative dot plots showing SVG9/HLA-A2 tetramer staining of CD8+ spleen cells from the vaccinated HHD II mice. Numbers indicate frequencies in each quadrant. *P < 0.05, ***P < 0.001, t-test

