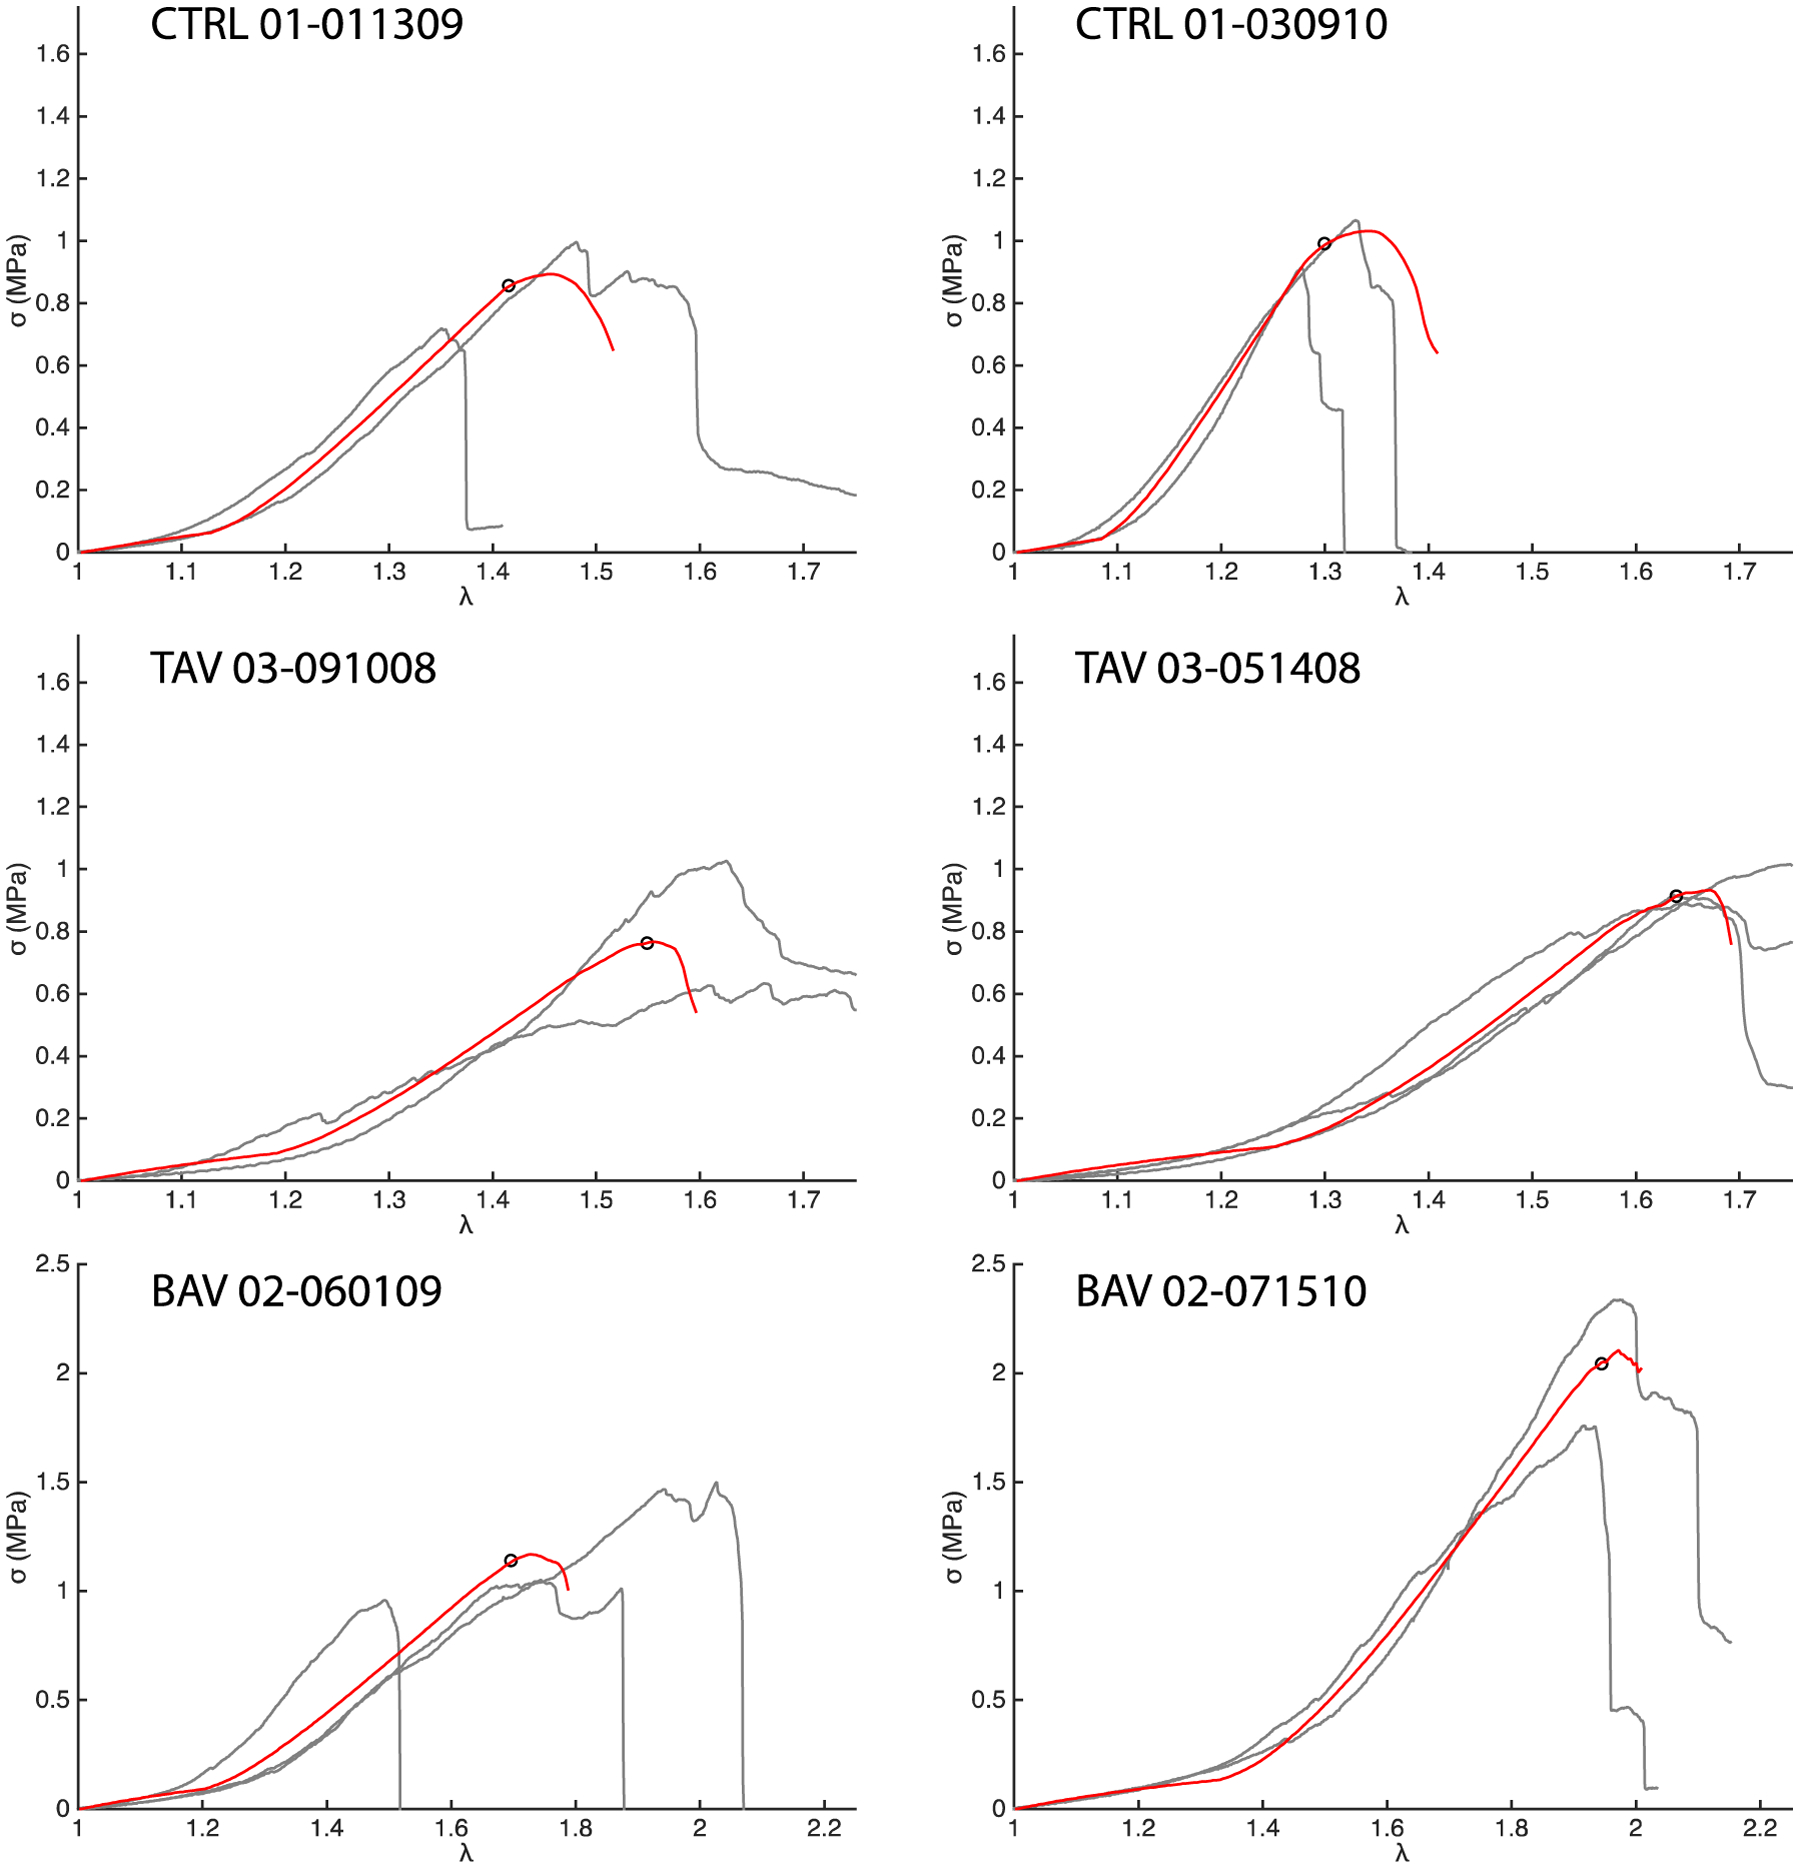
Fig. 5.

Representative CIRC simulations for two patients each from the CTRL, TAV, and BAV populations. The red curves show the simulation response and the grey curves the experimental data. The simulated stress-stretch curve for a patient was regressed against the average of all the experimental stress-stretch curves for that patient. The hollow black circles mark the average experimental ATA wall tissue strength for the patient.
