
Fig. 6.
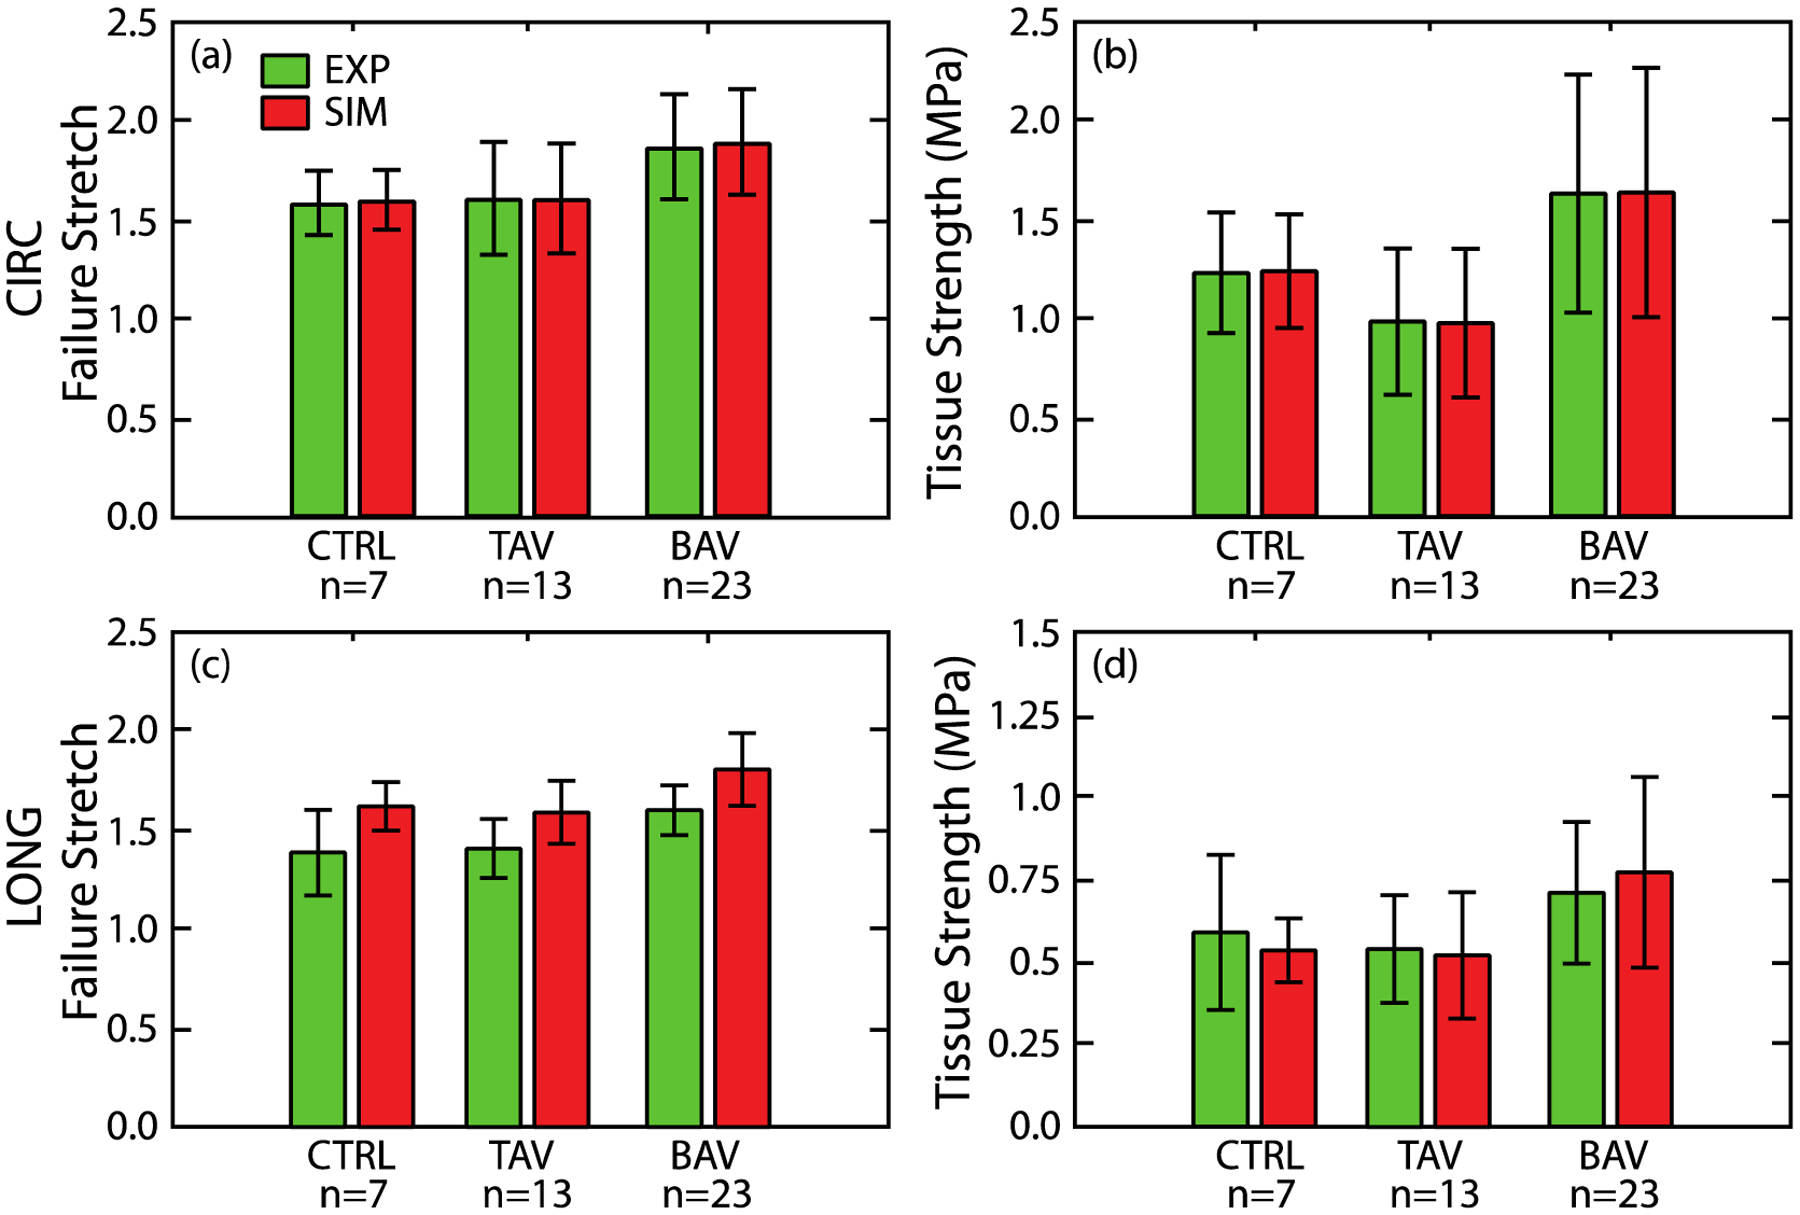
Failure stretch (a) and tissue strength (b) of the ATA wall tissue, estimated by the model, for all patient cohorts in the CIRC direction (red bars) along with corresponding experimentally measured values (green bars) (Pichamuthu et al., 2013). Predicted failure stretch (c) and tissue strength (d) of the ATA wall tissue for all patient cohorts in the LONG direction (red bars) along with corresponding experimental measurements (green bars) (Pichamuthu et al., 2013). There is no significant difference in the mean or standard deviations between the model predicted failure properties and experimental measurements for any patient cohort.