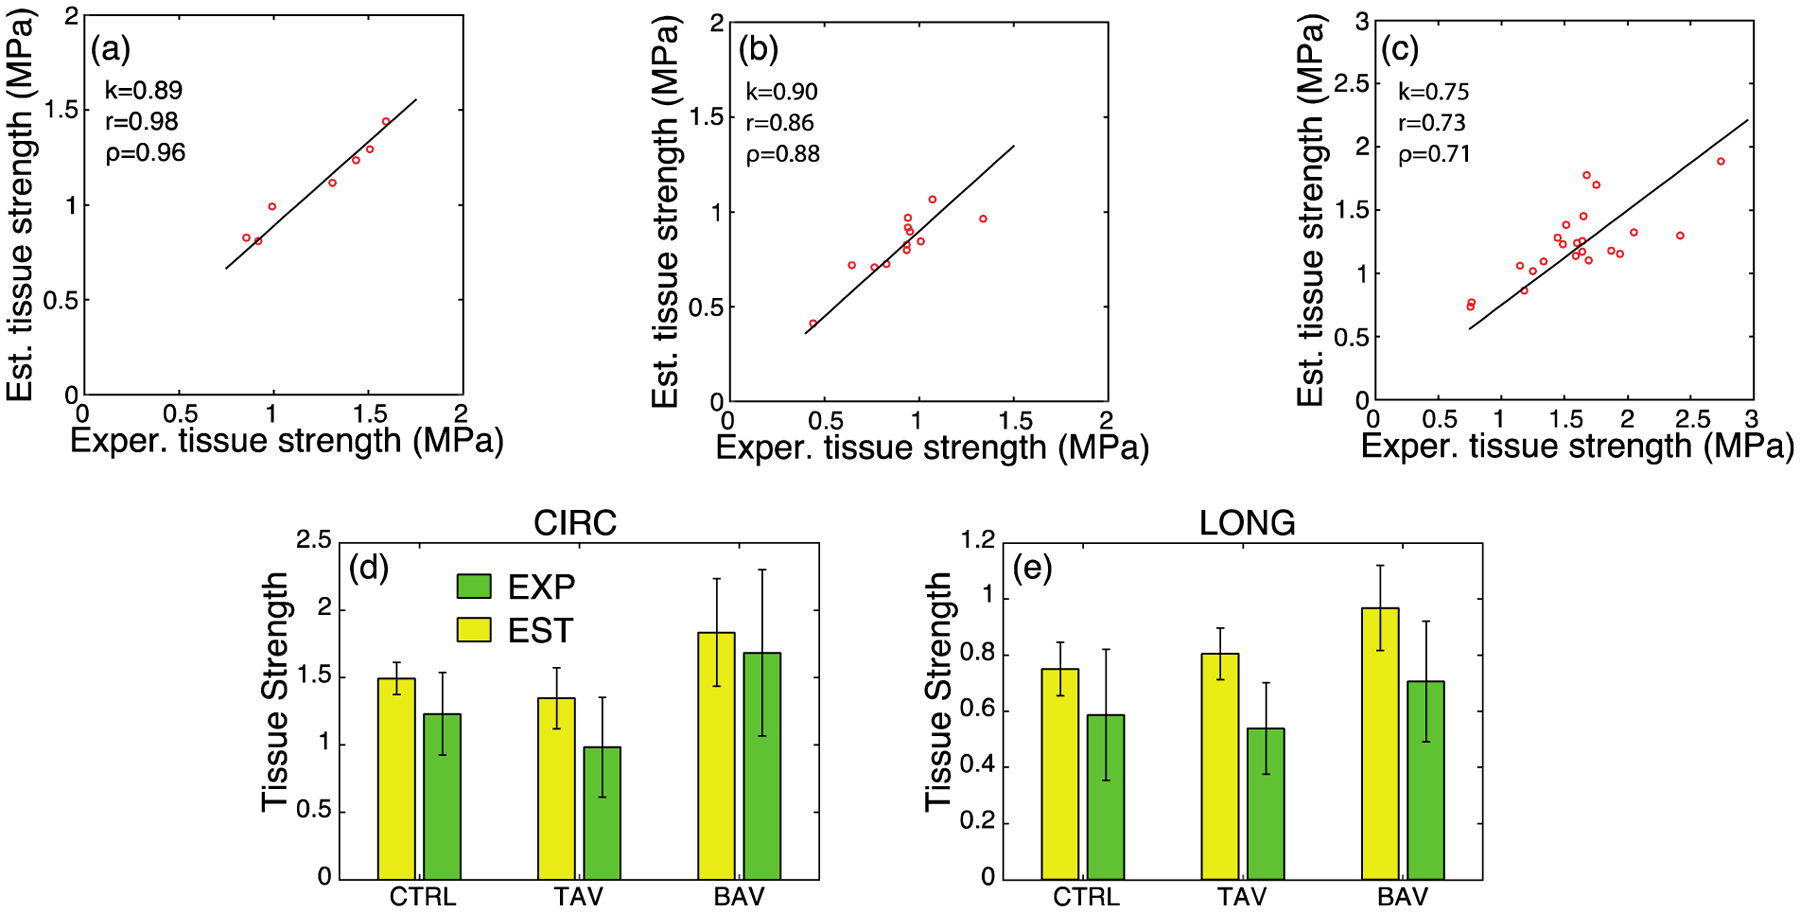
Fig. 9.

Comparison of the experimental tissue strength and analytically estimated tissue strength using Eq. (2) for the (a) CTRL, (b) TAV, and (c) BAV populations under CIRC loading. k denotes the slope of a regression line through the origin and r and ρ represent the Pearson correlation and Spearman’s rank correlation, respectively. (d) Experimental (green) and estimated (yellow) tissue strengths in the CIRC direction. (e) Experimental (green) and estimated (yellow) tissue strengths in the LONG direction. For all cohorts in both the directions, no statistical difference was found between experimental and corresponding analytically estimated tissue strength.
