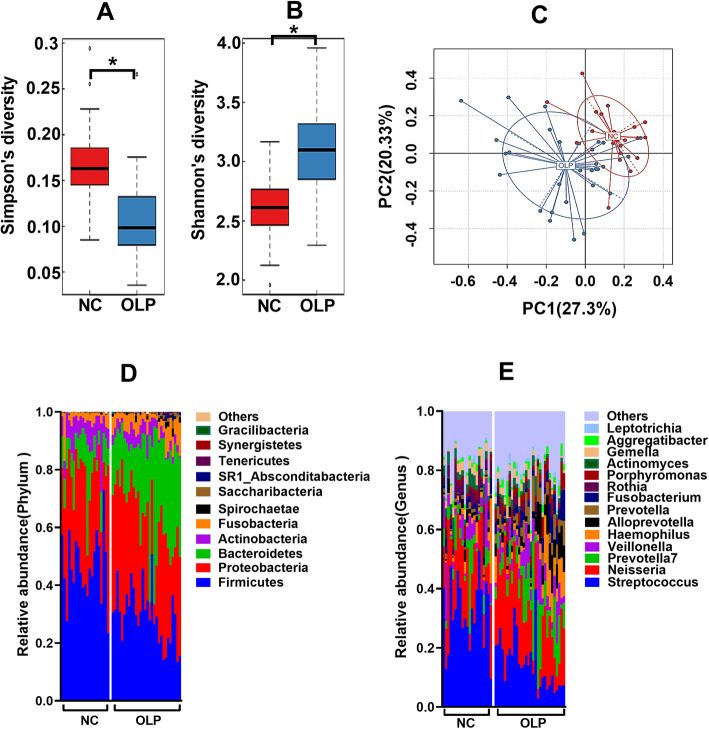
Fig. 1.
Comparison of the salivary microbiome profiles between the NC (n = 21) and OLP groups (n = 30). a Simpson’s diversity index of salivary microbiome in the NC and OLP groups (p = 0.00003). b Shannon’s diversity index of salivary microbiome in the NC and OLP groups (p = 0.0002). c Principal coordinate analysis (PCoA) plots of unweighted UniFrac distances of oral microbiota in the NC and OLP groups. Comparative analysis of the oral microbiome composition at the phylum (d) and genus (e) levels between the NC and OLP groups. *p < 0.05

