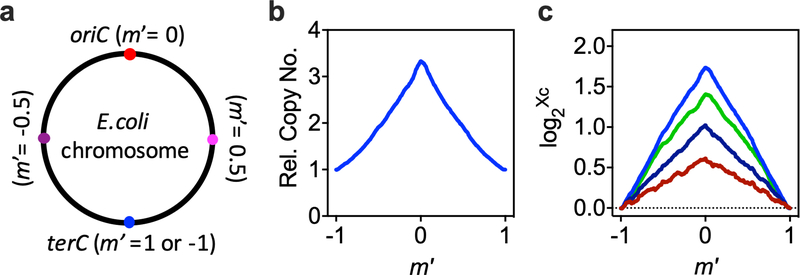
Extended Data Fig. 6 |. Measurement of the C period by deep sequencing.
a, Definition of the relative chromosomal location (m′). To characterize the C period, the genome was binned into over 900 fragments of size 5,000bp. The relative chromosomal location for each fragment (m′) is defined by its relative location between oriC (m′ = 0) and terC (m′ = ±1). b, Dependence of relative gene copy number (Xc) on chromosome location for cells grown in M1 (Extended Data Fig. 1). The relative gene copy number was obtained by normalizing the deep sequencing counts for each fragment to the count number for the fragment containing terC (Methods). c, Linear correlation between the logarithm of the relative copy number of the fragment and m′. Representative plots of 4 biologically independent samples have been presented. Colors represent growth media: blue, green, navy, and red correspond to M1, M3, M13, and M23, respectively (Extended Data Fig. 1).

