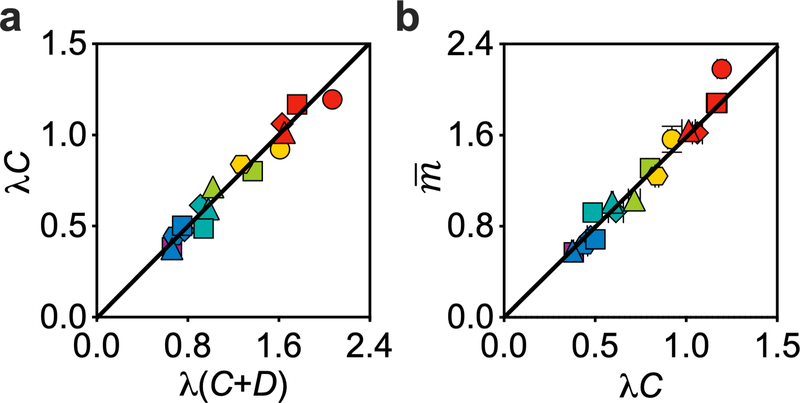
Extended Data Fig. 7 |. The Linear relation between C and C + D.
a, The logarithm of population-averaged cellular origin number, which equals to λ(C+D), is proportional to λC, which was determined by deep sequencing as described in Methods and Extended Data Fig. 6. The direct proportionality between the independently measured λ(C+D) and λC suggests that the C period is proportional to the sum of the C and D periods. b, The population-averaged cellular mass scales linearly (R2 > 0.94) with λC, a measure of average number of replication positions per chromosome, with best-fit slope OD600·ml/109 cells or 0.89 ± 0.04 pg DW/cell. Symbols and error bars represent the mean±SDs of the data. Sample size and mean value for each symbol are provided in Extended Data Fig. 8.

