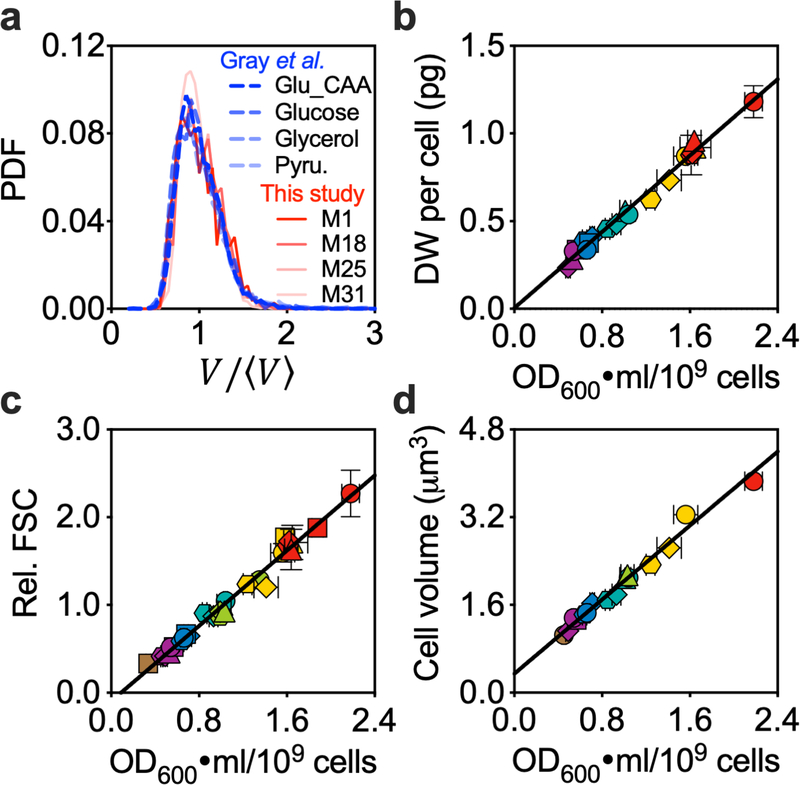
Extended Data Fig. 3 |. Tight correlation of different measures for cellular mass or size.
a, Density distributions (in Probability Density Function, PDF) for cell volume normalized by average cell size, as quantified by automated image analysis (Methods), for cells taken from the conditions described in Fig. 1d. Distributions for cells at comparable growth rates from Gray et al.18 were taken for comparison. When normalized by mean cell size, the different distributions appear very similar. b-d, The dry weight (DW) per cell (b), relative FSC (forward scatter) (c), and cell volume (d) plotted against the OD600·ml per 109 cells. All three measures are linearly correlated with the OD600·ml per 109 cells. The cell volume is expected to be a precise quantitative measure of cell size. However, data sets from different published studies5,18,40,43 show an approximately two-fold difference for the same strain or closely related stains under similar growth conditions, possibly due to the difficulty in quantifying the actual cell diameter based on microscopic images. Given the variability in the measured FSC or cell volume, and the convenience and robustness in quantifying the cell number concentration and OD600, we used the OD600·ml per 109 cells as the population-averaged cellular mass for the rest of the current study. Symbols and error bars in panels b-d (except for the y axis of panel d) represent the mean±SDs of the; many of the error bars were smaller than the size of the symbols. Symbols and error bars on y axis of panel d represent mean with 95% CI of population-averaged cell volume. Sample size and mean value for each symbol are provided in Extended Data Fig. 8.

