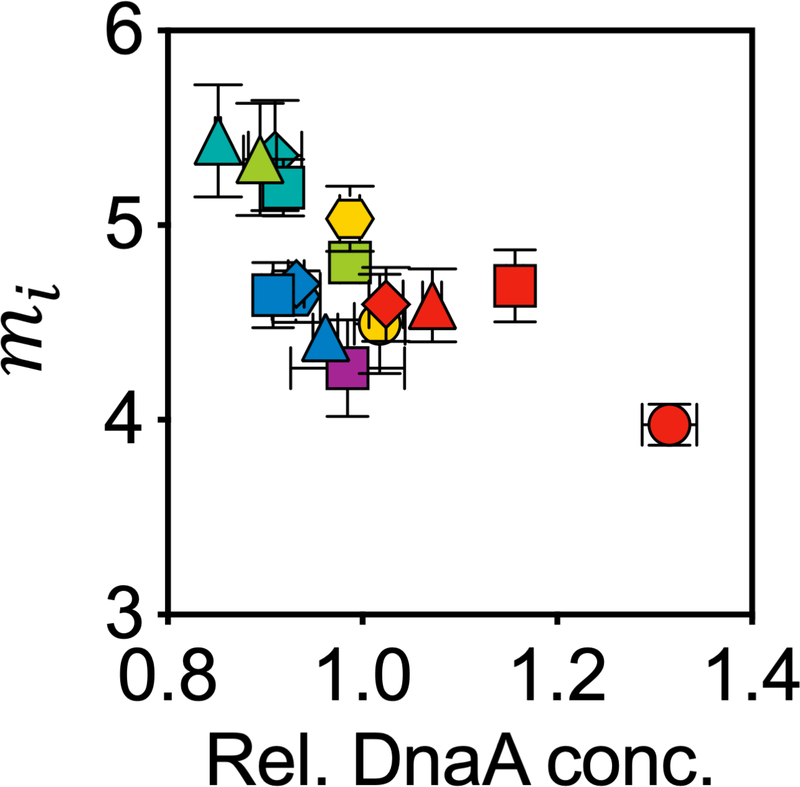
Extended Data Fig. 5 |. Negative correlation of initiation mass with relative DnaA protein concentration.
Shown are the initiation mass from Fig. 3a and the corresponding relative DnaA concentrations from Fig. 3d. Symbols and error bars represent the mean±SDs of the data. Sample size and mean value for each symbol are provided in Extended Data Fig. 8.

