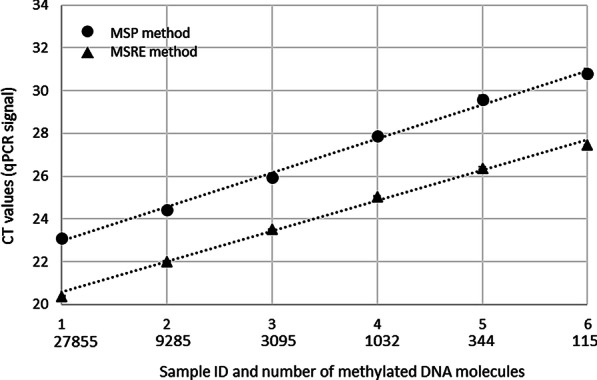
Fig. 4.

Comparison between signal generated from MSRE-qPCR and MS-qPCR. The methylation level of the CpG island of the human MGMT gene was analyzed in a set of 6 spike-in samples containing different amount of artificially methylated and unmethylated DNA. Signals originated from MSRE-qPCR and MS-qPCR are marked by black rectangles and black circles, respectively. Cycle threshold (CT) values are indicated on the Y-axis. Sample IDs and calculated methylated DNA copy number (considering that one DNA molecule weighs 3.59 pg [43]) originally present in the samples before restriction digestion or bisulfite conversion is indicated on the X-axis. Each sample was tested using 100 ng of spike-in DNA in three technical replicates
