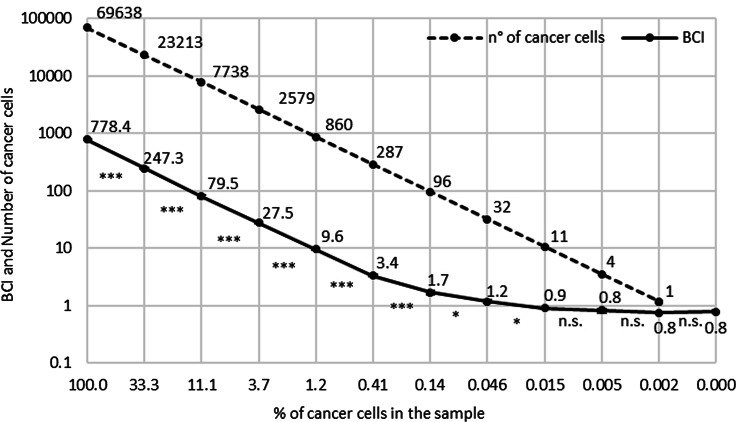
Fig. 5.
Determination of Bladder CARE linearity and LOD. Bladder CARE linearity and LOD: comparison between the number of cancer cells (LD583 cancer cell line [41]) originally present in the 12 spike-in samples (dashed line and numbers above it) and the correspondent Bladder CARE Index (BCI) value (solid line and numbers above it). Each sample was tested using 500 ng of spike-in DNA in three technical replicates. Significant differences in BCI between two consecutive samples are indicated by asterisks below the solid line. n.s. = not significant. Although barely visible, error bars for technical replicates are reported for each spike-in sample. Percentage of cancer cells in each spike-in sample (500 ng, correspondent to approximately 70,000 cells considering that one DNA molecule weighs 3.59 pg [43]) is indicated in the X-axis. BCI value and number of cancer cells are represented in the Y-axis (logarithmic scale)

