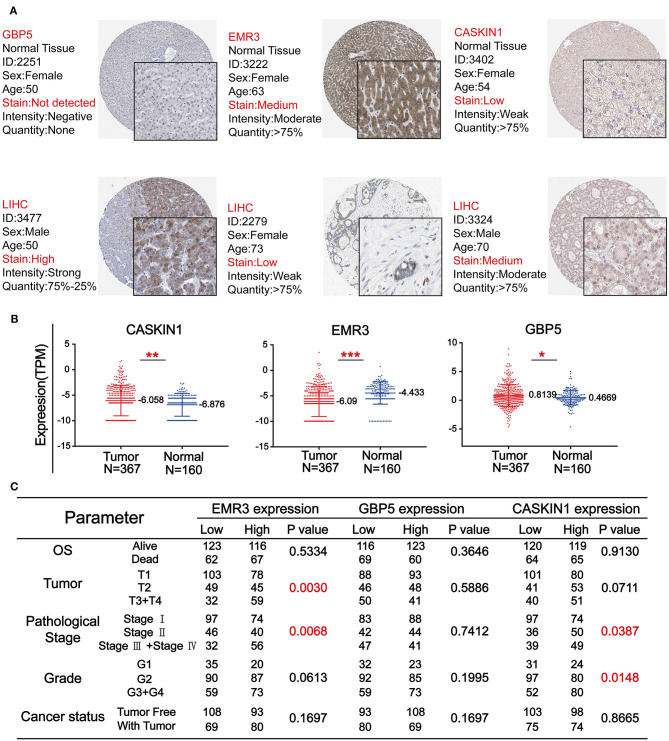
Figure 5.
The expression level of three genes in HCC. (A) The immunohistochemistry (IHC) results from the Human Protein Atlas (HPA) was used to detect the protein level of three genes in normal and tumor tissues. (B) Comparison of the expression levels of CASKIN1, EMR3, and GBP5 genes in HCC tissues and adjacent normal tissues form the Cancer Genome Atlas (TCGA) database. The values of *p < 0.5, **p < 0.01, and ***p < 0.001 between the two groups. (C) Chi-square test of the clinical parameters according to the median of the expressions of the three genes.

