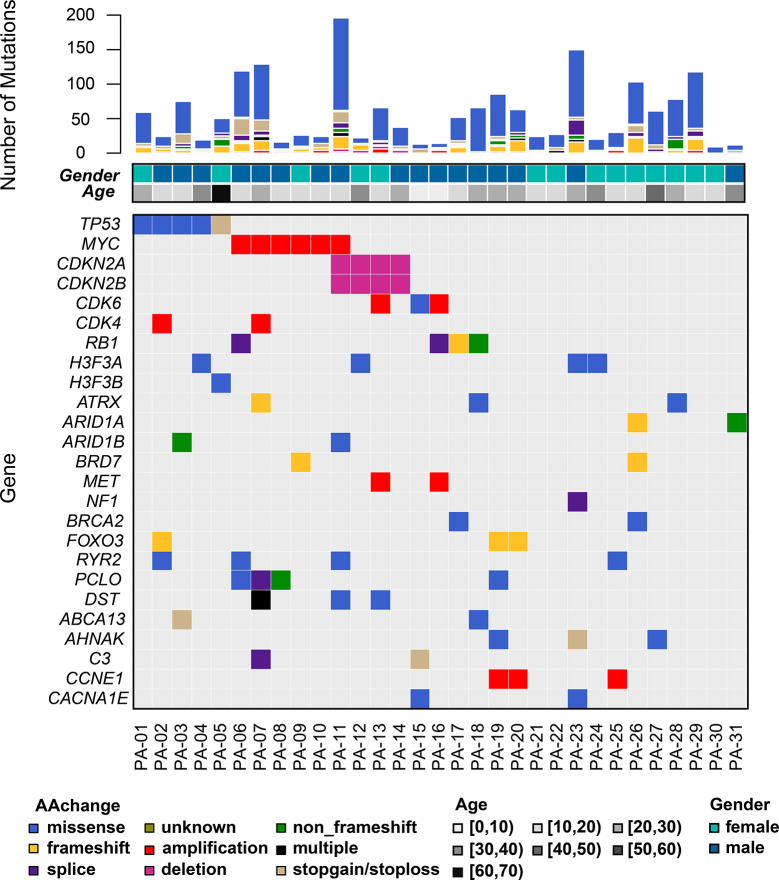
Figure 1.
The mutational landscape of somatic alterations. Mutated genes are listed on the left-side. The genes with the mutations occurring ≥4 per sample and reported driver genes were included. Each column represents a sample. Top bar plot summarizes the numbers of mutations per sample shown with corresponding age and gender. Different colors refer to mutational types and ages at low panel.

