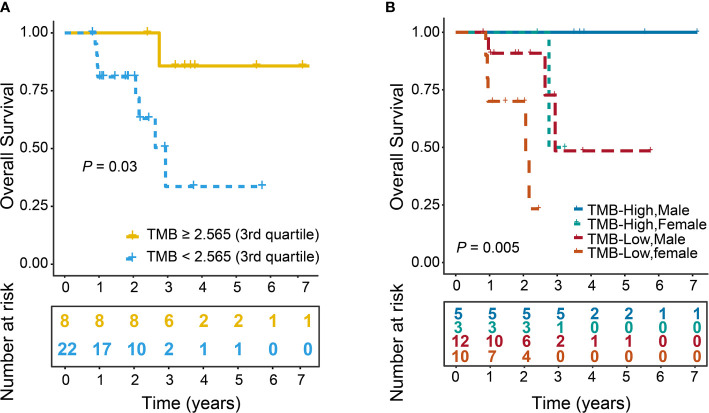
Figure 4.
Improved OS in patients with high TMB. TMB was stratified with a binary cutoff of 2.565 (3rd quartile). Log-rank test was used to calculate P value. (A) OS curves of TMB-High and TMB-Low groups (P = 0.03). (B) OS curves of patients stratified by the combination of Gender and TMB. TMB-High Males (n=5), TMB-High Females (n=3), TMB-Low Males (n=12), TMB-Low Females (n=10) (P=0.005). The numbers in parentheses represented the number patients in each group.

