. 2021 Apr 20:L21-0108. doi: 10.7326/L21-0108

Figure 2. Tree of SARS-CoV-2 genomes generated from this patient and contextual SARS-CoV-2 genomes from surrounding states (MA, CT, RI, VT, NH, ME, and NY) as of 5 February 2021 from the National Center for Biotechnology Information GenBank.
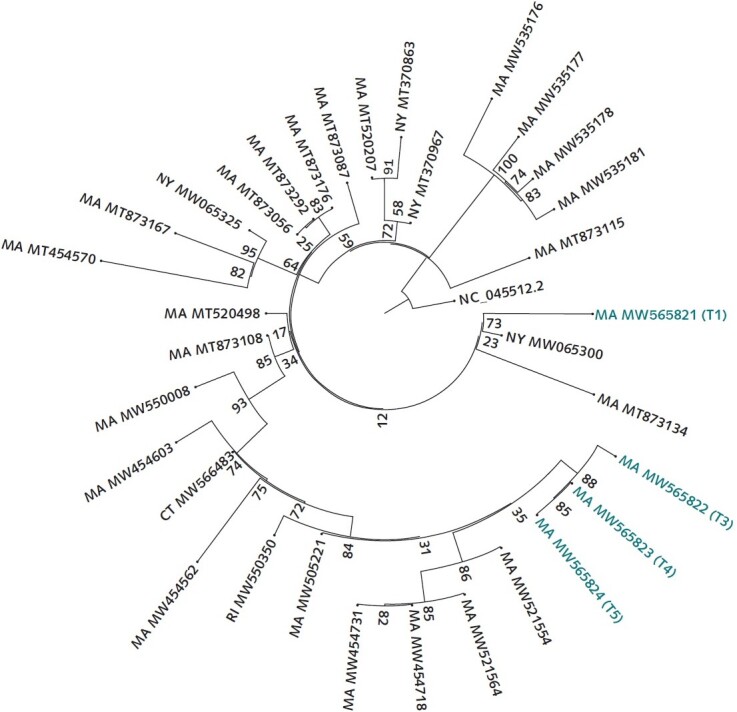
Figure 2. Tree of SARS-CoV-2 genomes generated from this patient and contextual SARS-CoV-2 genomes from surrounding states (MA, CT, RI, VT, NH, ME, and NY) as of 5 February 2021 from the National Center for Biotechnology Information GenBank. Similarity by genetic distance and placement on the phylogenetic tree show that the second infection is more closely related to and descended from infections circulating in the community than from the viral genome sequenced from the first infection. The sequences were aligned to the reference NC_045512.2 using MAFFT. A maximum likelihood tree was created via IQ-Tree with the general time-reversible model with empirical base frequencies and 3 FreeRate categories, as selected by minimum Akaike information criterion. CT = Connecticut; MA = Massachusetts; ME = Maine; NH = New Hampshire; NY = New York; RI = Rhode Island; VT = Vermont.

Similarity by genetic distance and placement on the phylogenetic tree show that the second infection is more closely related to and descended from infections circulating in the community than from the viral genome sequenced from the first infection. The sequences were aligned to the reference NC_045512.2 using MAFFT. A maximum likelihood tree was created via IQ-Tree with the general time-reversible model with empirical base frequencies and 3 FreeRate categories, as selected by minimum Akaike information criterion. CT = Connecticut; MA = Massachusetts; ME = Maine; NH = New Hampshire; NY = New York; RI = Rhode Island; VT = Vermont.