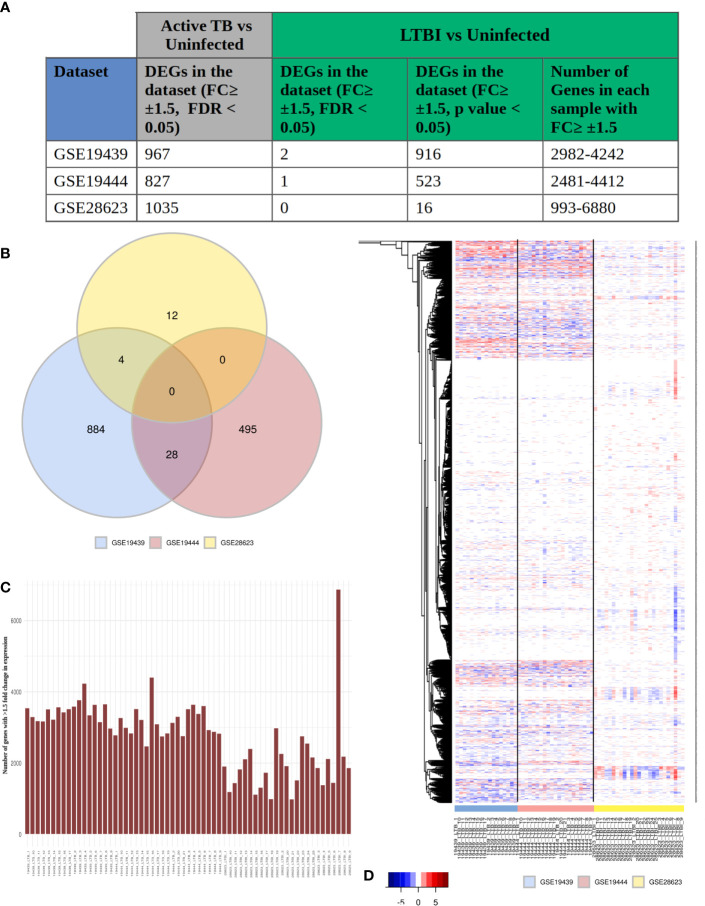
Figure 1.
LTBI patients have a highly heterogeneous gene expression profile. (A) The three selected datasets GSE19439, GSE19444 and GSE28623 showed a significant number of genes to be differentially regulated in active TB condition but very few DEGs in LTBI when compared to uninfected cases with conventional thresholds of FDR ≤0.05 and fold change ≥ ± 1.5 criteria. More number of genes could be considered as DEGs if the criteria are modified to unadjusted p value ≤0.05 and fold change ≥ ± 1.5. However each of these samples contained thousands of genes with ≥ ± 1.5 fold change in gene expression compared to uninfected individuals. (B) Venn diagram shows that there are no common DEGs in LTBI condition (unadjusted p value ≤0.05, fold change ≥ ± 1.5) between all three datasets. The number of common DEGs between any two datasets are also very few. (C) Each LTBI sample contained over 1000 genes with ≥ ± 1.5 fold change, showing a significant difference between the gene expression profile of the individual samples from uninfected cases. (D) Heatmap shows the fold change of expression of the genes in each individual LTBI sample that showed (≥ ± 1.5) fold change in any sample (union of all genes from Figure 1A , column 5). White signifies no significant fold change (≤ ± 1.5), red stands of upregulation in gene expression and blue shows downregulation. It is clear that although all the samples show significant change in the gene expression profiles, it is not consistent across the samples, suggesting a heterogeneous response to LTBI in humans.

