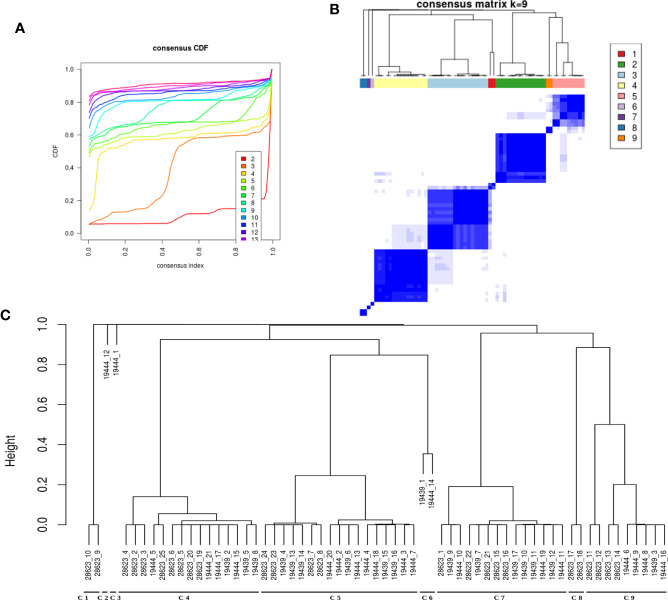
Figure 3.
LTBI samples can be divided into groups based on pathway perturbation. (A, B) The LTBI samples can be divided into 9 substantially stable clusters based on their pathway perturbation patterns. The cumulative distribution function (CDF) plot shows that CDF reaches an approximate maximum as early as k=9 cluster. The clusters are significantly different from each other. 4 of the clusters contain the majority of the samples, whereas the few other samples show a highly varied pathway profile. (C) The dendrogram shows the samples in each cluster. The clustering was not biased by cohort or dataset as each of the large clusters contains samples from different datasets.

