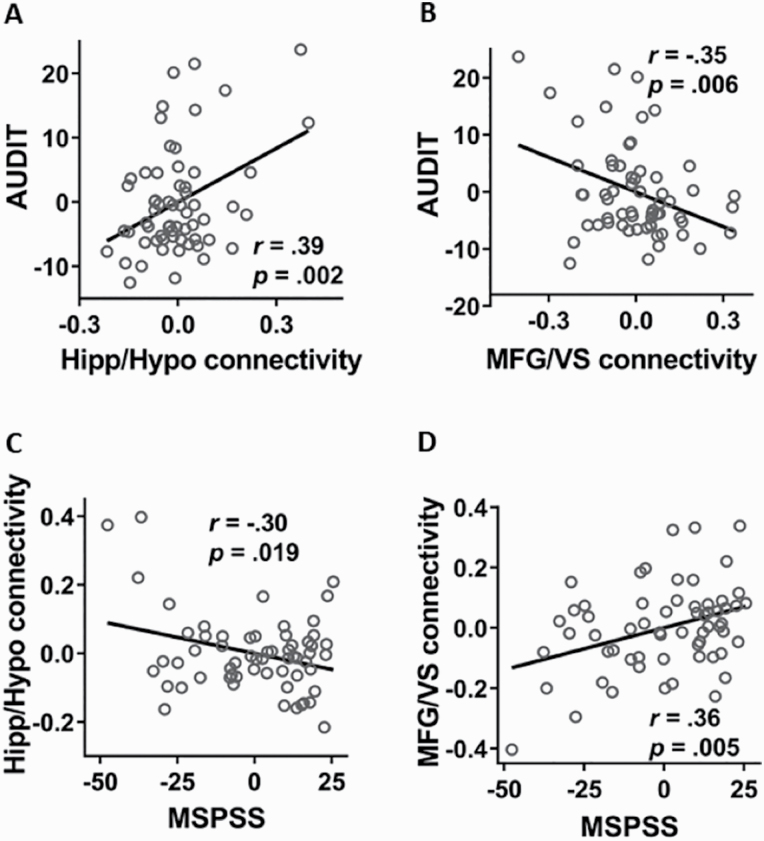
Figure 2.
AUDIT scores showed (A) a positive relationship with Hipp/Hypo rsFC and (B) a negative relationship with MFG/VS rsFC. MSPSS scores showed (C) a negative relationship with Hipp/Hypo rsFC and (D) a positive relationship with MFG/VS rsFC. Note that the scatterplots showed results of partial correlations after the effects of sex and age were removed (i.e., residuals were shown for each variable).

