Figure 1.
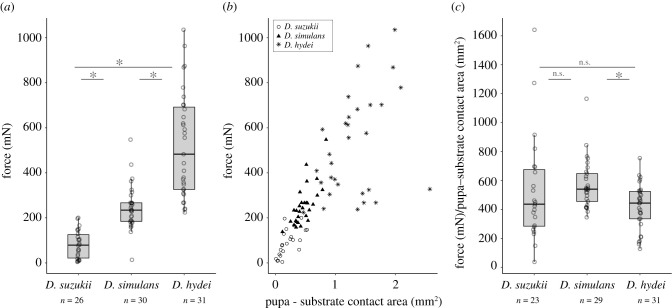
Pupa adhesion varies between species originating from the same location. (a) Adhesion strength of three Drosophila lines collected in Vincennes. Force indicates the force required to detach a pupa naturally attached to a glass slide. Each dot corresponds to a single pupa and n indicates the total number of pupae tested for each species. Ends of the boxes define the first and third quartiles. The black horizontal line represents the median. The vertical line on the top of the box extends to the largest value no further than 1.5 × IQR from the upper hinge of the box. The vertical line on the bottom of the box extends to the smallest value at most 1.5 × IQR of the hinge (IQR, inter-quartile range is the distance between the first and the third quartiles.). Data beyond the end of these lines are ‘outlying’ points. Asterisk indicates significant differences between D. suzukii and D. hydei, D. suzukii and D. simulans and D. simulans and D. hydei (p < 0.05). (b) Relationship between pupa adhesion force and pupa–substrate contact area. Each dot corresponds to a single pupa. Drosophila suzukii pupae are represented as circles, D. simulans as triangles and D. hydei as stars. (c) Adhesion strength corrected by the pupa–substrate contact area. Boxplots and asterisk as in (a). n.s. indicates not significant (p > 0.05).

