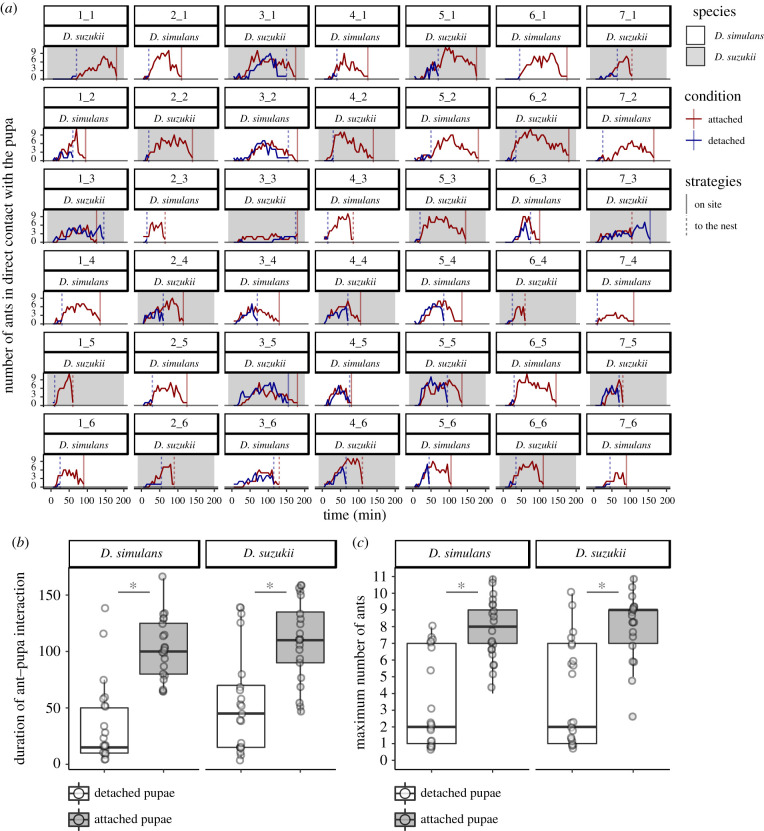
Figure 3.
Attached pupae require more time and more ants to go away. (a) Number of ants in direct contact with the pupa over the duration of the experiment. Each cell represents one experiment with X_Y corresponding to the experiment with the colony X during the trial Y. Grey cells represent experiments using D. suzukii and white cells using D. simulans. Red lines represent the number of ants over time on attached pupa and blue lines on detached pupa. Vertical lines represent the time when the attached pupa (in red) or the detached pupa (in blue) arrives in the nest (dashed line) or is fully consumed outside the nest (full line). (b) Time during which ants are in contact with attached pupa (grey box) and detached pupa (white box) outside the nest (until the pupa is completely consumed outside the nest or enters into the nest). Each dot represents one experiment. (c) Maximum number of ants observed in contact with detached pupa (white box) and attached pupa (grey box) during the duration of the experiment. Each dot represents one experiment. Boxplots are defined as previously (figure 1a). Asterisk indicates significant differences (p < 0.05, Wilcoxon tests).

