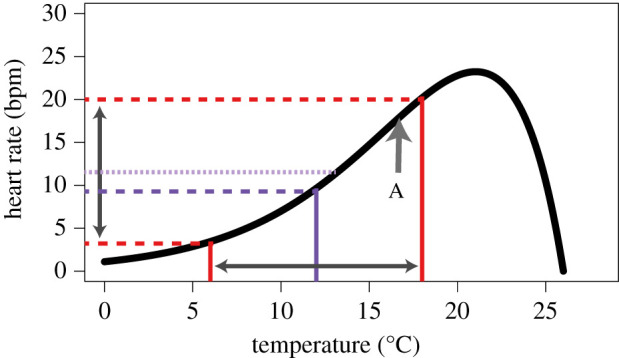
Figure 1.

A generalized thermal performance curve (TPC) for Mytilus trossulus relating heart rate to body temperature (redrawn using data from [3]) and illustrating predictions for mean responses over time under fluctuating conditions from Jensen's inequality. The red lines indicate rates derived from the extremes at 6 and 18°C while the purple lines indicate mean rates derived from a constant 12°C (dashed line) as well as variable temperatures between 6 and 18°C (dotted line). Point A indicates the inflection point of the curve (where it switches between acceleration and deceleration). In general, Jensen's inequality calculates that the mean of the response under fluctuating temperatures is elevated relative to the mean under constant temperatures in areas of the curve that are accelerating, while the converse is true in areas of the curve that are decelerating. The magnitude of this effect is directly related to both the amplitude of temperature variation and the degree of curvature of the TPC.
