Figure 2.
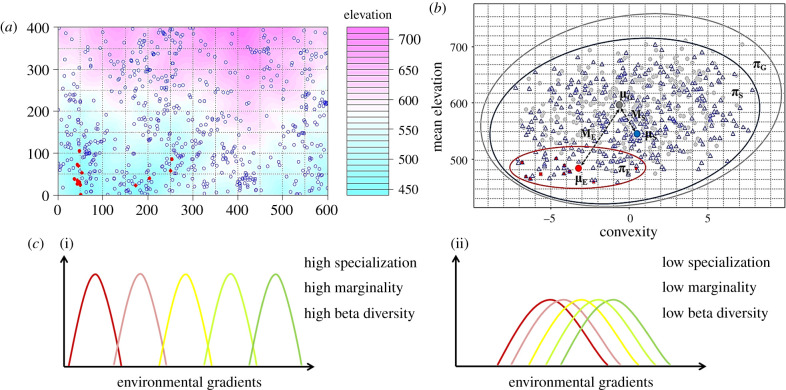
Illustration of niche specialization and marginality of Euonymus oblongifolius and Symplocos stellaris in the Gutianshan forest dynamics plot (600 × 400 m). (a) Red solid points represent the spatial distribution of E. oblongifolius, and blue circles represent the spatial distribution of S. stellaris. (b) Illustration of niche specialization and marginality of E. oblongifolius and S. stellaris in two-dimensional niche space based on mean elevation and convexity of distributed 20 × 20 m quadrats. Niche marginality is the distance from the mean habitat of the focal species to the mean habitat of community habitats. μE, μS and μG represent centroids of environmental conditions for E. oblongifolius, S. stellaris and the entire community, and distances ME and MS are niche marginalities of two species. Likewise, niche specialization is the ratio of the entire habitat range of a community to habitat range of the focal species. πE, πS and πG stand for the distributional range of for E. oblongifolius, S. stellaris and the entire community in two-dimensional niche space, respectively, the ratio of πG /πE and πG /πS are niche specialization of two species. Grey points indicate the topographical variation of the entire community, red squares show higher niche specialization and marginality of E. oblongifolius, whereas blue triangles indicate lower specialization and marginality of S. stellaris. (c) Hypothetical relationships between beta-diversity and niche. Higher community-level niche specialization indicates the fine partitioning of available niche space, while higher community-level niche marginality suggests a larger niche space. Therefore, higher specialization and marginality lead to a higher beta-diversity (i), while lower specialization and marginality lead to a lower beta-diversity (ii). (Online version in colour.)

