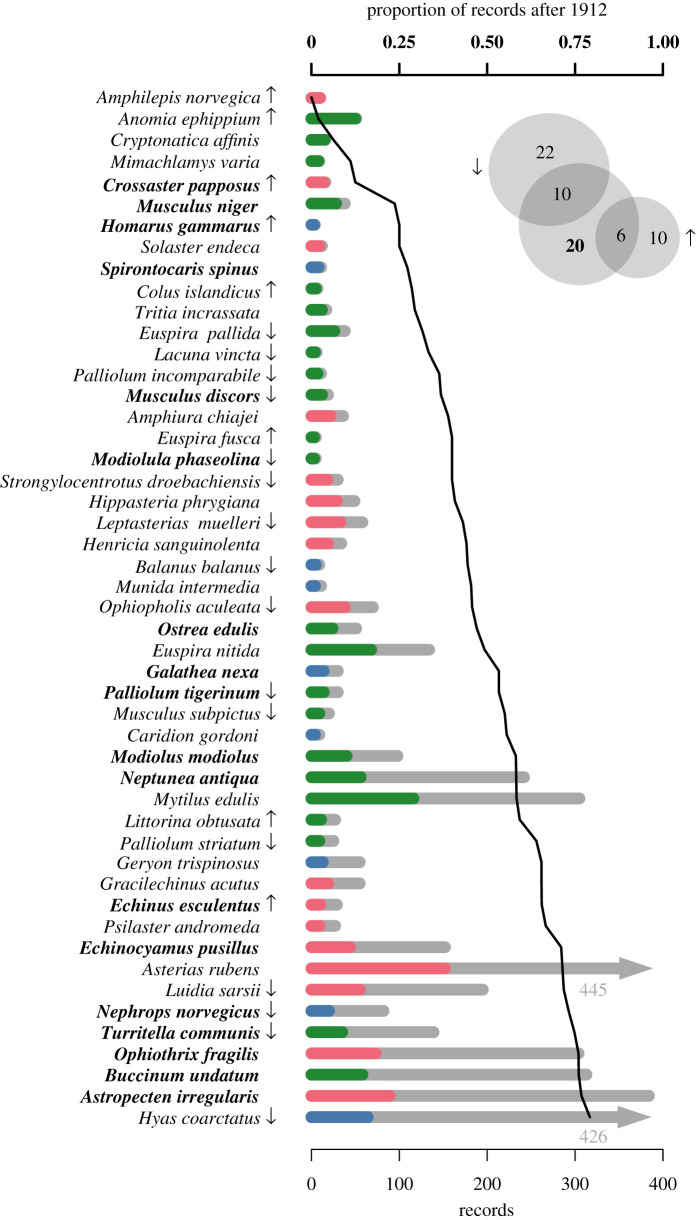
Figure 5.
Potentially declining species with relatively few records after 1912. The proportion of records after 1912 is shown by the bold line (top axis). Bar plot of the number of records available before and after 1912 as coloured and grey bars, respectively. Colours denote the supraspecific taxon: Crustacea (blue), Echinodermata (red) and Mollusca (green). Names of known endangered species [39] are bolded. Arrows indicate species that were significantly increasing or declining based on the GBIF Relative Observations Tool. The Venn diagram in the upper corner summarizes the cross-validation results from the GBIF Relative Observations Tool (arrows) and German Red List (bold number) as per cent species.

