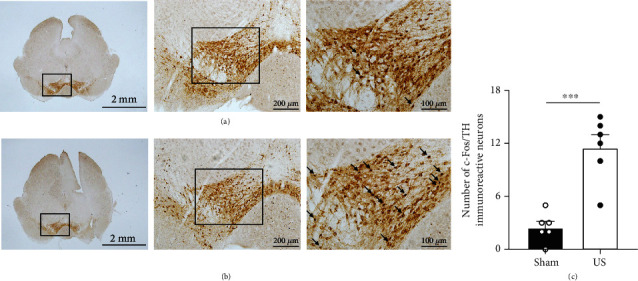
Figure 2.

Ultrasound stimulation increases the abundance of c-Fos-positive neurons in the VTA. Representative c-Fos expression of the VTA in (a) the sham group and (b) the US group. Double labelling of TH (brown) and c-Fos (black) in the VTA. Arrows indicate c-Fos-positive cells. (c) Number of c-Fos-positive cells in the US group, showing a significant increment compared to that in the sham group. c-Fos-positive cells costained with dopamine neurons were counted in the entire VTA region of the brain slice (n = 6, mean ± SEM, ∗∗∗p < 0.001, independent-sample t-test).
