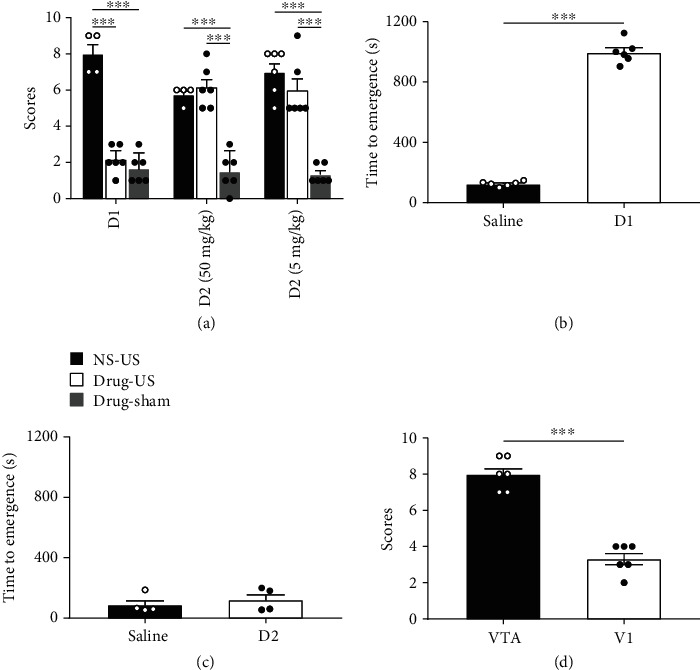
Figure 4.

Mechanism of ultrasound stimulation in reanimation from general anaesthesia. (a) Behavioral scores of the normal saline and drug groups (n = 4 for NS-US group, n = 6 for rest of the groups, mean ± SEM, ∗∗∗p < 0.001, p > 0.05, ANOVA). (b) Emergence time of the D1 receptor antagonist group and saline group (n = 4, mean ± SEM, ∗∗∗p < 0.001, independent-sample t-test). (c) Emergence time of the D2 receptor antagonist group (50 mg/kg) and saline group (n = 4, mean ± SEM, p > 0.05, independent-sample t-test). (d) Behavioral scores during ultrasound stimulation of the VTA and visual cortex (n = 6, mean ± SEM, ∗∗∗p < 0.001, independent-sample t-test).
