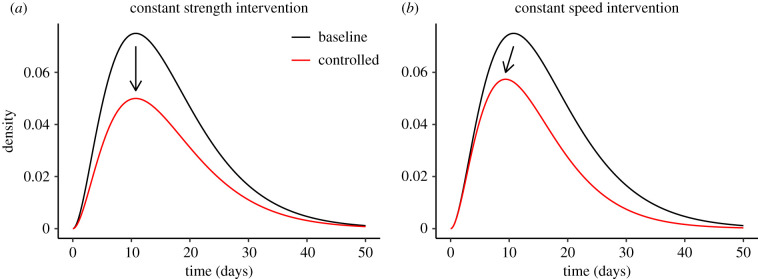
Figure 1.
Effects of constant-strength and constant-speed intervention on infection kernels. Ebola-like gamma infection kernel (pre-intervention) (mean: 16.2 days, CV: 0.58 and : 1.5) is shown in black [21]. The post-intervention kernel after applying each intervention strategy is shown in red. (a) The effect of a constant-strength intervention with θ = 1.5. A constant-strength intervention reduces the density by a constant proportion: ; when the strength of intervention matches the strength of epidemic (), the resulting distribution is equivalent to the intrinsic generation-interval distribution ()). (b) A constant-speed intervention with ϕ ≈ 0.0267/day is applied to the same kernel. A constant-speed intervention reduces the density exponentially: ; when the speed of intervention matches the speed of epidemic (), the resulting distribution is equivalent to the initial backward generation-interval distribution ()). (Online version in colour.)

