Figure 1.
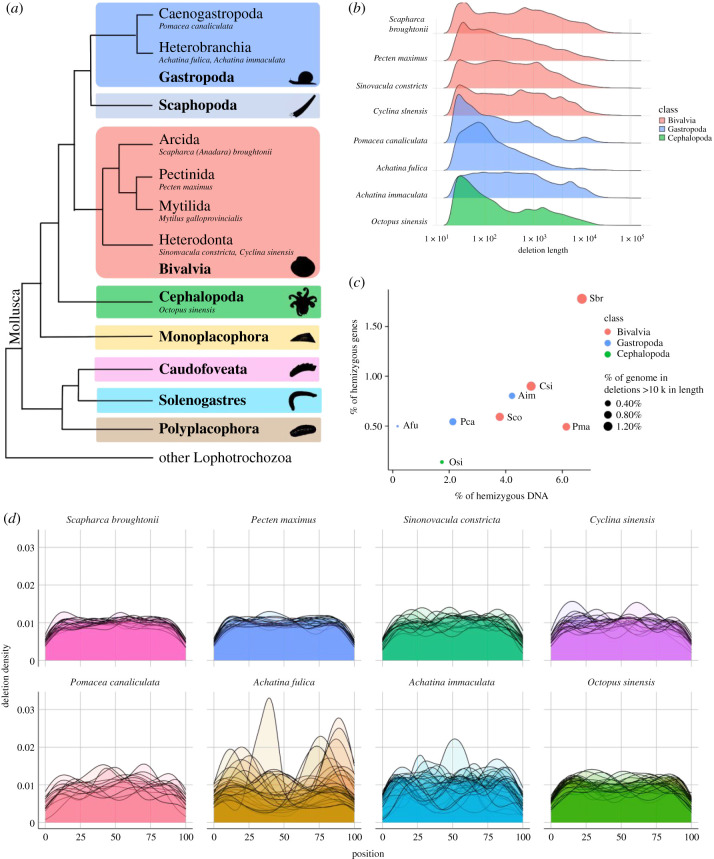
Phylogeny and hemizygous loci analyses of eight molluscan species. (a) Representative cladogram of mollusc relationships after Kocot et al. [23]. Species referenced in this manuscript are shown in italics. Note, in Bivalvia and Gastropoda, numerous subclades are not shown. (b) Length distribution of hemizygous regions (deletions, log10 on both axes). (c) Percentage of each genome which is hemizygous versus the percentage of all genes which reside entirely within hemizygous DNA. The size of each point is proportional to the percentage of the genome found in large (greater than 10 kb) hemizygous regions. Species include Achatina fulica (Afu), Achatina immaculata (Aim), Cyclina sinensis (Csi), Octopus sinensis (Osi), Pecten maximus (Pma), Pomacea canaliculata (Pca), Scapharca broughtonii (Sbr) and Sinonovacula constricta (Sco). (d) Density of hemizygous loci for each species. Each chromosome is represented by an individual data series (line) which spans the beginning (0% distance) to the end (100% distance) of each chromosome. (Online version in colour.)

