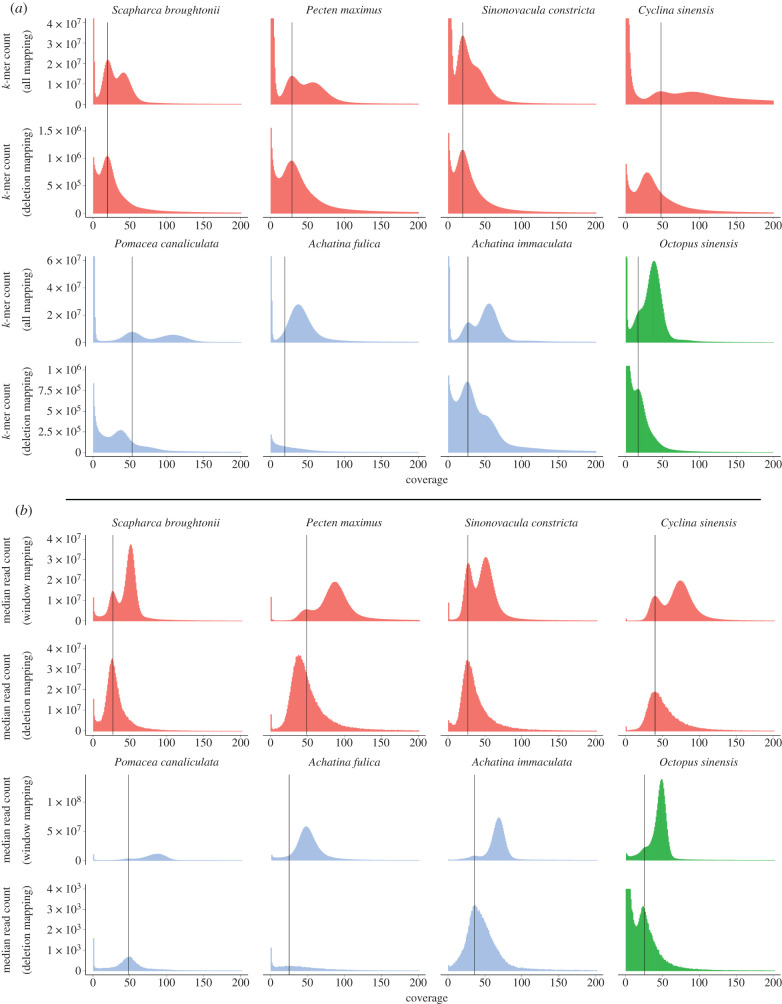
Figure 3.
k-mer and median read coverage analysis of hemizygous regions. (a) k-mer counts of all mapped reads for each genome with the corresponding k-mer counts of reads that map entirely within hemizygous regions located directly below. (b) Median read coverage of all 1000 bp sliding windows for each genome with the corresponding median read coverage of all annotated hemizygous regions located directly below. For both (a) and (b) the black vertical lines mark the ‘heterozygous’ peaks of the total mapped reads k-mer or median read coverage plots. Species are colour coded by class with red for bivalves, blue for gastropods and green for the cephalopod.

