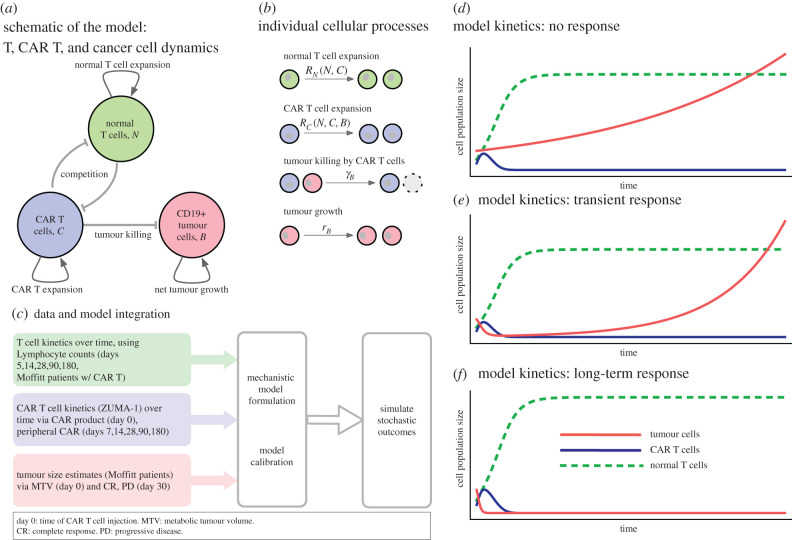
Figure 1.
Overview of cellular interactions, kinetics, data integration and qualitative dynamics. (a) Model schematic of three cell compartments: CAR T cells, C, proliferate and interact with resident (normal) lymphocytes, N (depleted by lymphodepleting chemotherapy). CAR T cells also engage in killing CD19+ tumour and other B cells. (b) The system can be described by four cellular kinetic reactions, with density-dependent feedback (differences in carrying capacities) in the net expansion rates: RX = rX ln(KX/(N + C)), where X stands for N or C. The deterministic, large population size limit of these dynamics is given by equations (2.1)–(2.3). (c) Schematic of data integration to parametrize the mathematical model; we used longitudinal data of peripheral absolute lymphocyte count (ALC), peripheral CAR+ cell counts per µL, and the tumour volume-changes as estimated from patients of the ZUMA-1 trial with complete response (CR) or progressive disease (PD). We assumed that, at days 30, 60 or 90, CRs had no detectable tumour mass, and that PDs had 1.2 times their initial tumour size. Median initial tumour mass was 94.86 ml. The qualitative dynamics of the system, given by equations (2.1)–(2.3): no response to CAR therapy (d), transient response followed by progression/relapse (e) and long-term response (tumour appears to be eradicated) (f). These illustrative examples are not to scale.

