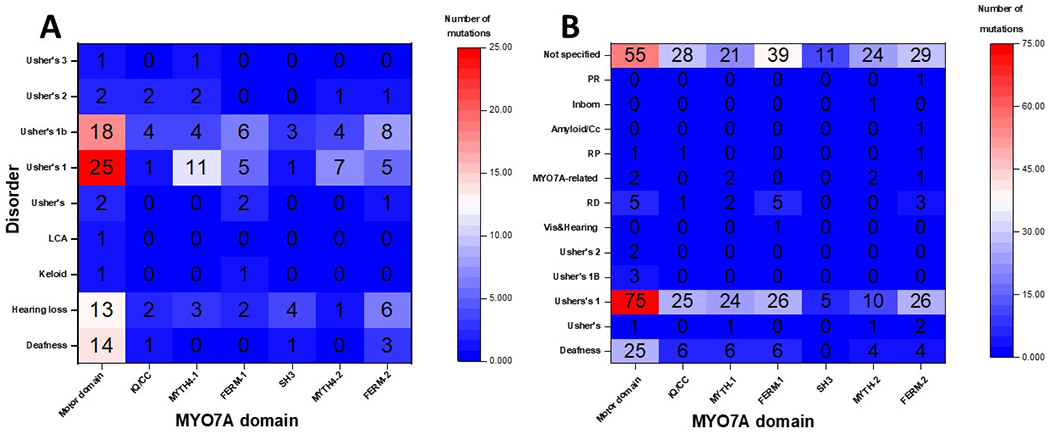
Figure 3.

Heatmaps presents the relationships between the location of missense changes in MYO7A domains and disease phenotypes. (A) A heatmap shows the statistical distribution of HGMD missense alterations over MYO7A structural domains. (B) A heatmap shows the statistical distribution of ClinVar missense alterations over MYO7A structural domains.The numbers of the heatmap correspond to the number of HGMD or ClinVar missense mutations for given structural domain and disease phenotype.
