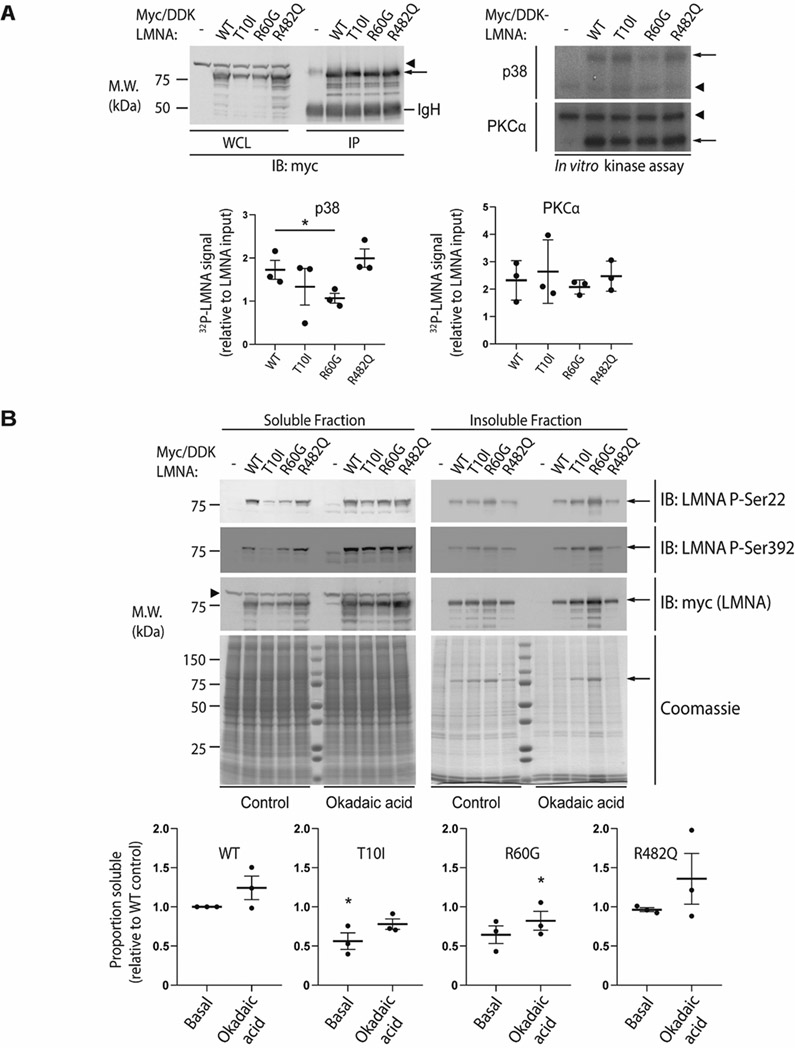
Figure 8. The disease-associated R60G mutation alters LMNA phosphorylation in vitro and reduces LMNA solubility.
(A) Huh7 cells were transfected with myc/DDK-tagged wild-type (WT) LMNA or the indicated LMNA mutant, then harvested in RIPA buffer followed by immunoprecipitation of LMNA using antibodies directed against the myc/DDK tag. Top left panel, WT and mutant LMNA were immunoprecipitated from cell lysates and analyzed by SDS-PAGE followed by immunoblot; tagged LMNA is indicated with an arrow. The immunoglobulin heavy chain (IgH) is labeled, and a non-specific band is indicated via arrowhead. Top right panel, in vitro phosphorylation of immunoprecipitated LMNA was carried out using recombinant p38 (top) or PKCα (bottom) followed by SDS-PAGE and autoradiography; 32P signal corresponding to myc/DDK-LMNA is indicated by an arrow, with an arrowhead indicating a non-specific band. Bottom panels, 32P-LMNA signal was quantitated relative to LMNA input using ImageJ software. Data shown were derived from n=3 independent experiments, and error bars represent standard error of the mean (SEM). Pairwise comparison using Student’s t test was used to determine statistical significance; *, P<0.05. (B) Top panels, Huh7 cells were transfected with myc/DDK-tagged WT LMNA or the indicated LMNA mutant, treated with 500 nM okadaic acid for 1 hour at 37 °C where indicated, and harvested in 1% Triton X-100 lysis buffer containing protease and phosphatase inhibitors. The Triton-insoluble pellet was then boiled in SDS buffer, and Triton-soluble and insoluble (pellet) fractions were analyzed by SDS-PAGE followed by immunoblot using the indicated primary antibodies. Coomassie-stained gels are shown to demonstrate equal protein loading. Myc/DDK-tagged LMNA is indicated via arrow; arrowhead indicates a non-specific band. Bottom panels, the soluble proportion of tagged LMNA was quantitated via ImageJ relative to WT LMNA under basal conditions, with WT LMNA under basal conditions arbitrarily set to 1.0. Data shown were derived from n=3 independent experiments, and error bars represent standard error of the mean (SEM). For each condition (basal and okadaic acid-treated), paired Friedman ANOVA was performed to compare WT to mutant LMNA, followed by uncorrected Dunn’s test for multiple comparison adjustment to determine statistical significance; *, P<0.05. M.W., apparent molecular weight; kDa, kilodaltons; IP, immunoprecipitate.

