
Figure 4.
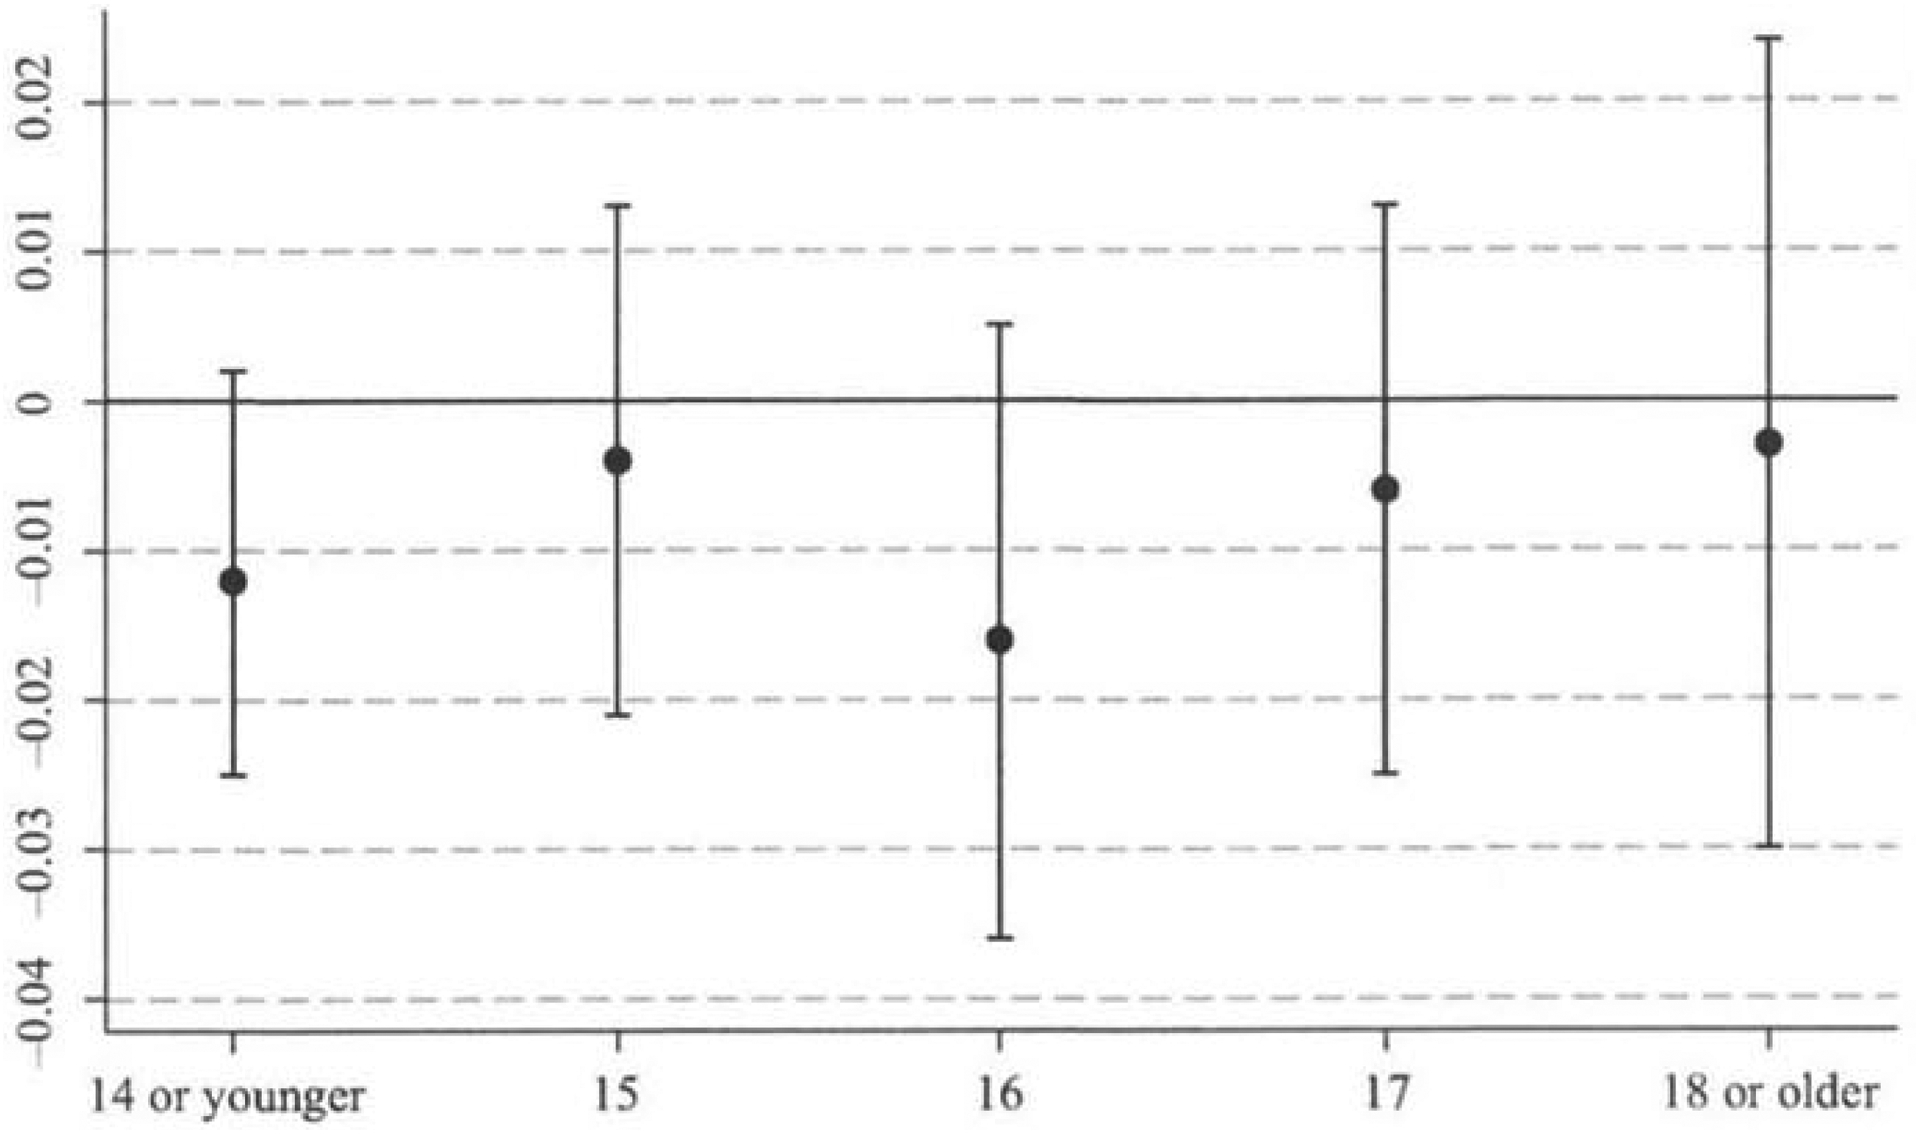
Cigarette Taxes and Current Marijuana Use by Age, 1991–2005
Notes: Average marginal effects (and their 95 percent confidence intervals) come from logit regressions based on data from the YRBS for the period 1991–2005. All models control for the covariates listed in Table 1, state fixed effect and year fixed effects. Standard errors are corrected for clustering at the state level.