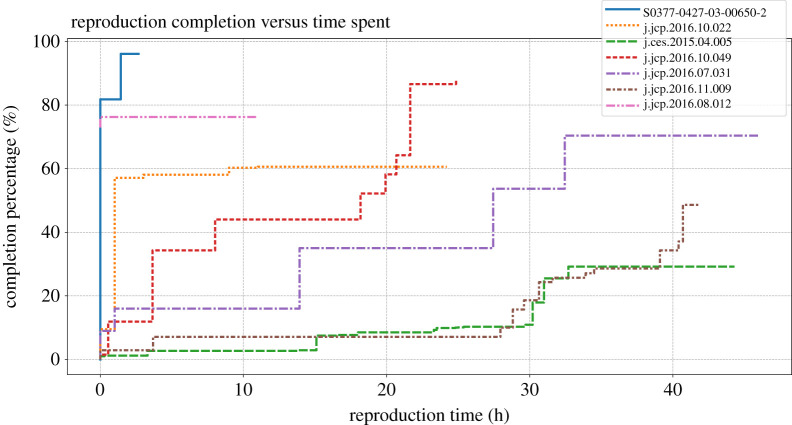
Figure 1.
Our efforts to reproduce each article took varying amounts of time (up to 40 h) and yielded varying levels of success. We tracked our progress on each article by noting when significant events occurred and how much of the article we had reproduced at each of these points. Progress is measured by first enumerating the number of computed numbers within tables and plots within figures, referred to as ‘assets’. We rate our completion of each article as the percentage of assets that have been reproduced. Details about which assets were completed when are recorded in each Reproduction Package with a file namednotes.txt. We present the completion percentage over time for each article in this study. The solid line is for article [18], the dotted line is for [14], the long dashed line is for [17], the short dashed line is for [16], the long dash dotted line is for [13], the short dash dotted line is for [15] and the long dash double dotted line is for [12]. For each figure, the x-axis is time measured in hours; the y-axis is the completion measured in percentage. Occasionally, we reached insurmountable roadblocks, terminating our reproduction effort prematurely (before 40 h had been spent). (Online version in colour.)

