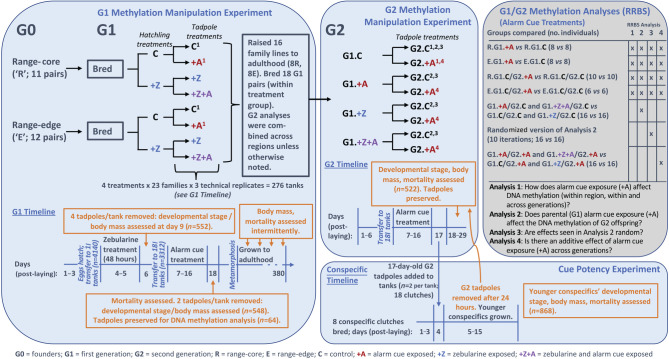
Figure 1.
Experimental design of common-garden experiment exploring intergenerational effects of methylation manipulation of cane toads. Left panel depicts the founders (G0) and first generation (G1), including the methylation manipulation experiment. Centre (upper) panel depicts the second generation (G2) manipulations, including parents' (G1) treatment. Bottom right panel depicts the cue potency experiment, in which conspecific tadpoles were exposed to tadpoles from the G2 methylation manipulation experiment (blue arrow). Top right panel describes which individuals were included in each DNA methylation analysis, including the geographic region where applicable, and treatment (G2 comparisons include their parents’ treatment codes). Timelines for each experiment are given, indicating the timepoints of assays (orange). Superscripts following treatment codes refer to the corresponding reduced representation bisulfite sequencing (RRBS) RRBS Analysis number in the methylation analyses table. Treatment codes are defined at the bottom of the figure.

