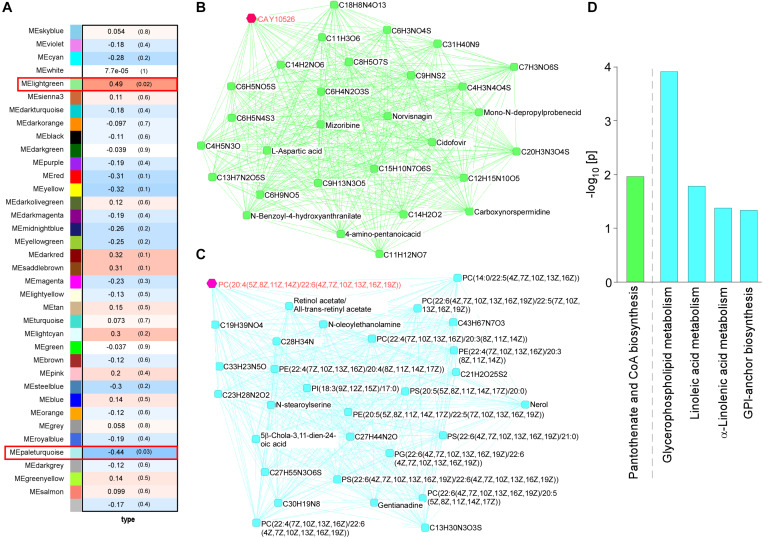
FIGURE 2.
Impact of ABCA7 haplodeficiency and peripheral LPS stimulation on mouse cortical metabolomes. (A) The correlation between metabolite module eigengenes and the four groups of mice: (1) control with LPS administration, (2) Abca7± with LPS administration, (3) control with LPS administration, and (4) Abca7± with LPS administration. Each module is represented with a unique color. The module traits were correlated with the four groups of mice (1–4). The corresponding correlations and P-values are displayed in each module. (B,C) The interactions of top 30 hub metabolites within the lightgreen (B) and paleturquoise (C) modules were visualized. (D) Pathway analysis of metabolites using the KEGG database. Pathways in the lightgreen (B) and paleturquoise (C) modules are shown (raw p-value < 0.05).

