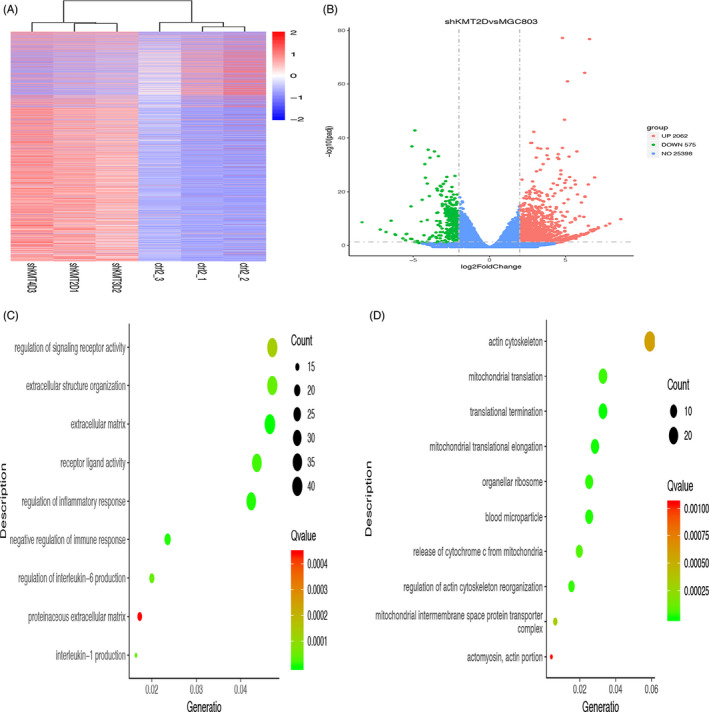
Figure 5.

Effects of KMT2D knockdown on the expression of genes in MGC803 gastric cancer cells. A, Gene clustering analysis after the KMT2D knockdown; (B) analysis of the differential genes in the cells after the KMT2D knockdown; (C) GO functional enrichment analysis of the upregulated genes after the KMT2D knockdown; (D) GO functional enrichment analysis of the downregulated genes after the KMT2D knockdown (each bubble in the bubble diagram indicates a function. The horizontal axis of the bubble indicates the concentration factor of the function in the GO analysis, while the size of bubble indicates the number of genes enriched in this function).
