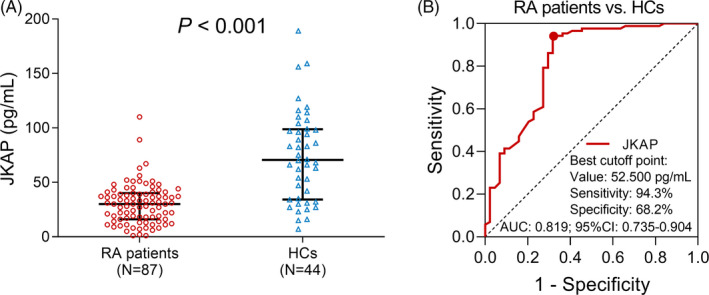
FIGURE 1.

The JKAP expression, and its predictive value for RA risk by ROC curve. Comparison of JKAP expression between RA patients and HCs (A); the predictive value of JKAP for RA risk by ROC curve (B). JKAP, JNK pathway‐associated phosphatase; RA, rheumatoid arthritis; HCs, healthy controls; ROC, receiver operating characteristic; AUC, area under the curve.
