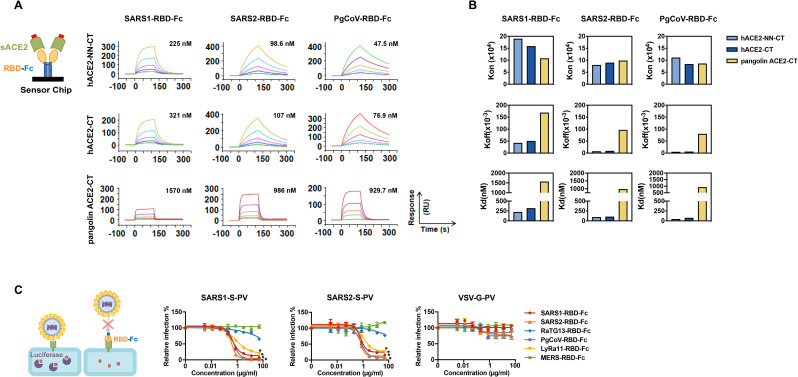
Fig 2. Surface-plasmon resonance and pseudovirus inhibition studies of SARS1-RBD, SARS2-RBD, PgCoV-RBD, LyRa11-RBD.
(A) Biacore surface plasmon resonsance (SPR) studies were performed with the indicated RBD-Fc (yellow and blue) captured on the sensor chip. The soluble monomeric forms of the indicated ACE2 variants (green, with a four-amino-acid C-terminal tag in red) were injected for analysis as represented in the figure. Biacore X100 sensorgrams representing results from studies in which the indicated RBD-Fc variants were captured by an anti-human Fcγ antibody immobilized on a CM5 chip after instantaneous background depletion. Monomeric forms of tagged soluble human ACE2 (hACE2-CT), human ACE2 lacking its active-site histidines (hACE2-NN-CT), or pangolin ACE2-CT were injected at five concentrations, serially diluted by two-fold from the highest concentration (100 nM for human ACE2 variants). The experiment is representative of two with similar results. (B) The association rate constant (kon), dissociation rate constant (koff), and equilibrium dissociation constant (Kd) were calculated and plotted for comparison from the study shown in (A). (C) 293T-hACE2 cells were pre-incubated with the indicated concentrations of the indicated RBD-Fc variants, and subsequently infected with retroviral pseudoviruses (PV) pseudotyped with the S proteins of SARS-CoV-1 (SARS1-S-PV), SARS-CoV-2 (SAR2-S-PV), or with the G protein of vesicular stomatitis virus (VSV-G-PV), as diagrammed. Nonlinear fit for log(inhibitor) vs. response was calculated for each RBD. In both SARS1-S-PV and SARS2-S-PV panels, SARS-RBD-Fc, SARS2-RBD-Fc, PgCoV-RBD-Fc, LyRa11-RBD-Fc bottom plateaus CI did not overlap with values from VSV-G-PV. Error bars in indicate standard error of the mean (S.E.M) and are representative of results from at least two independent experiments. Asterisks indicate lack of 95% CI overlap of RBD-Fc constructs with respect to VSV-G group.

