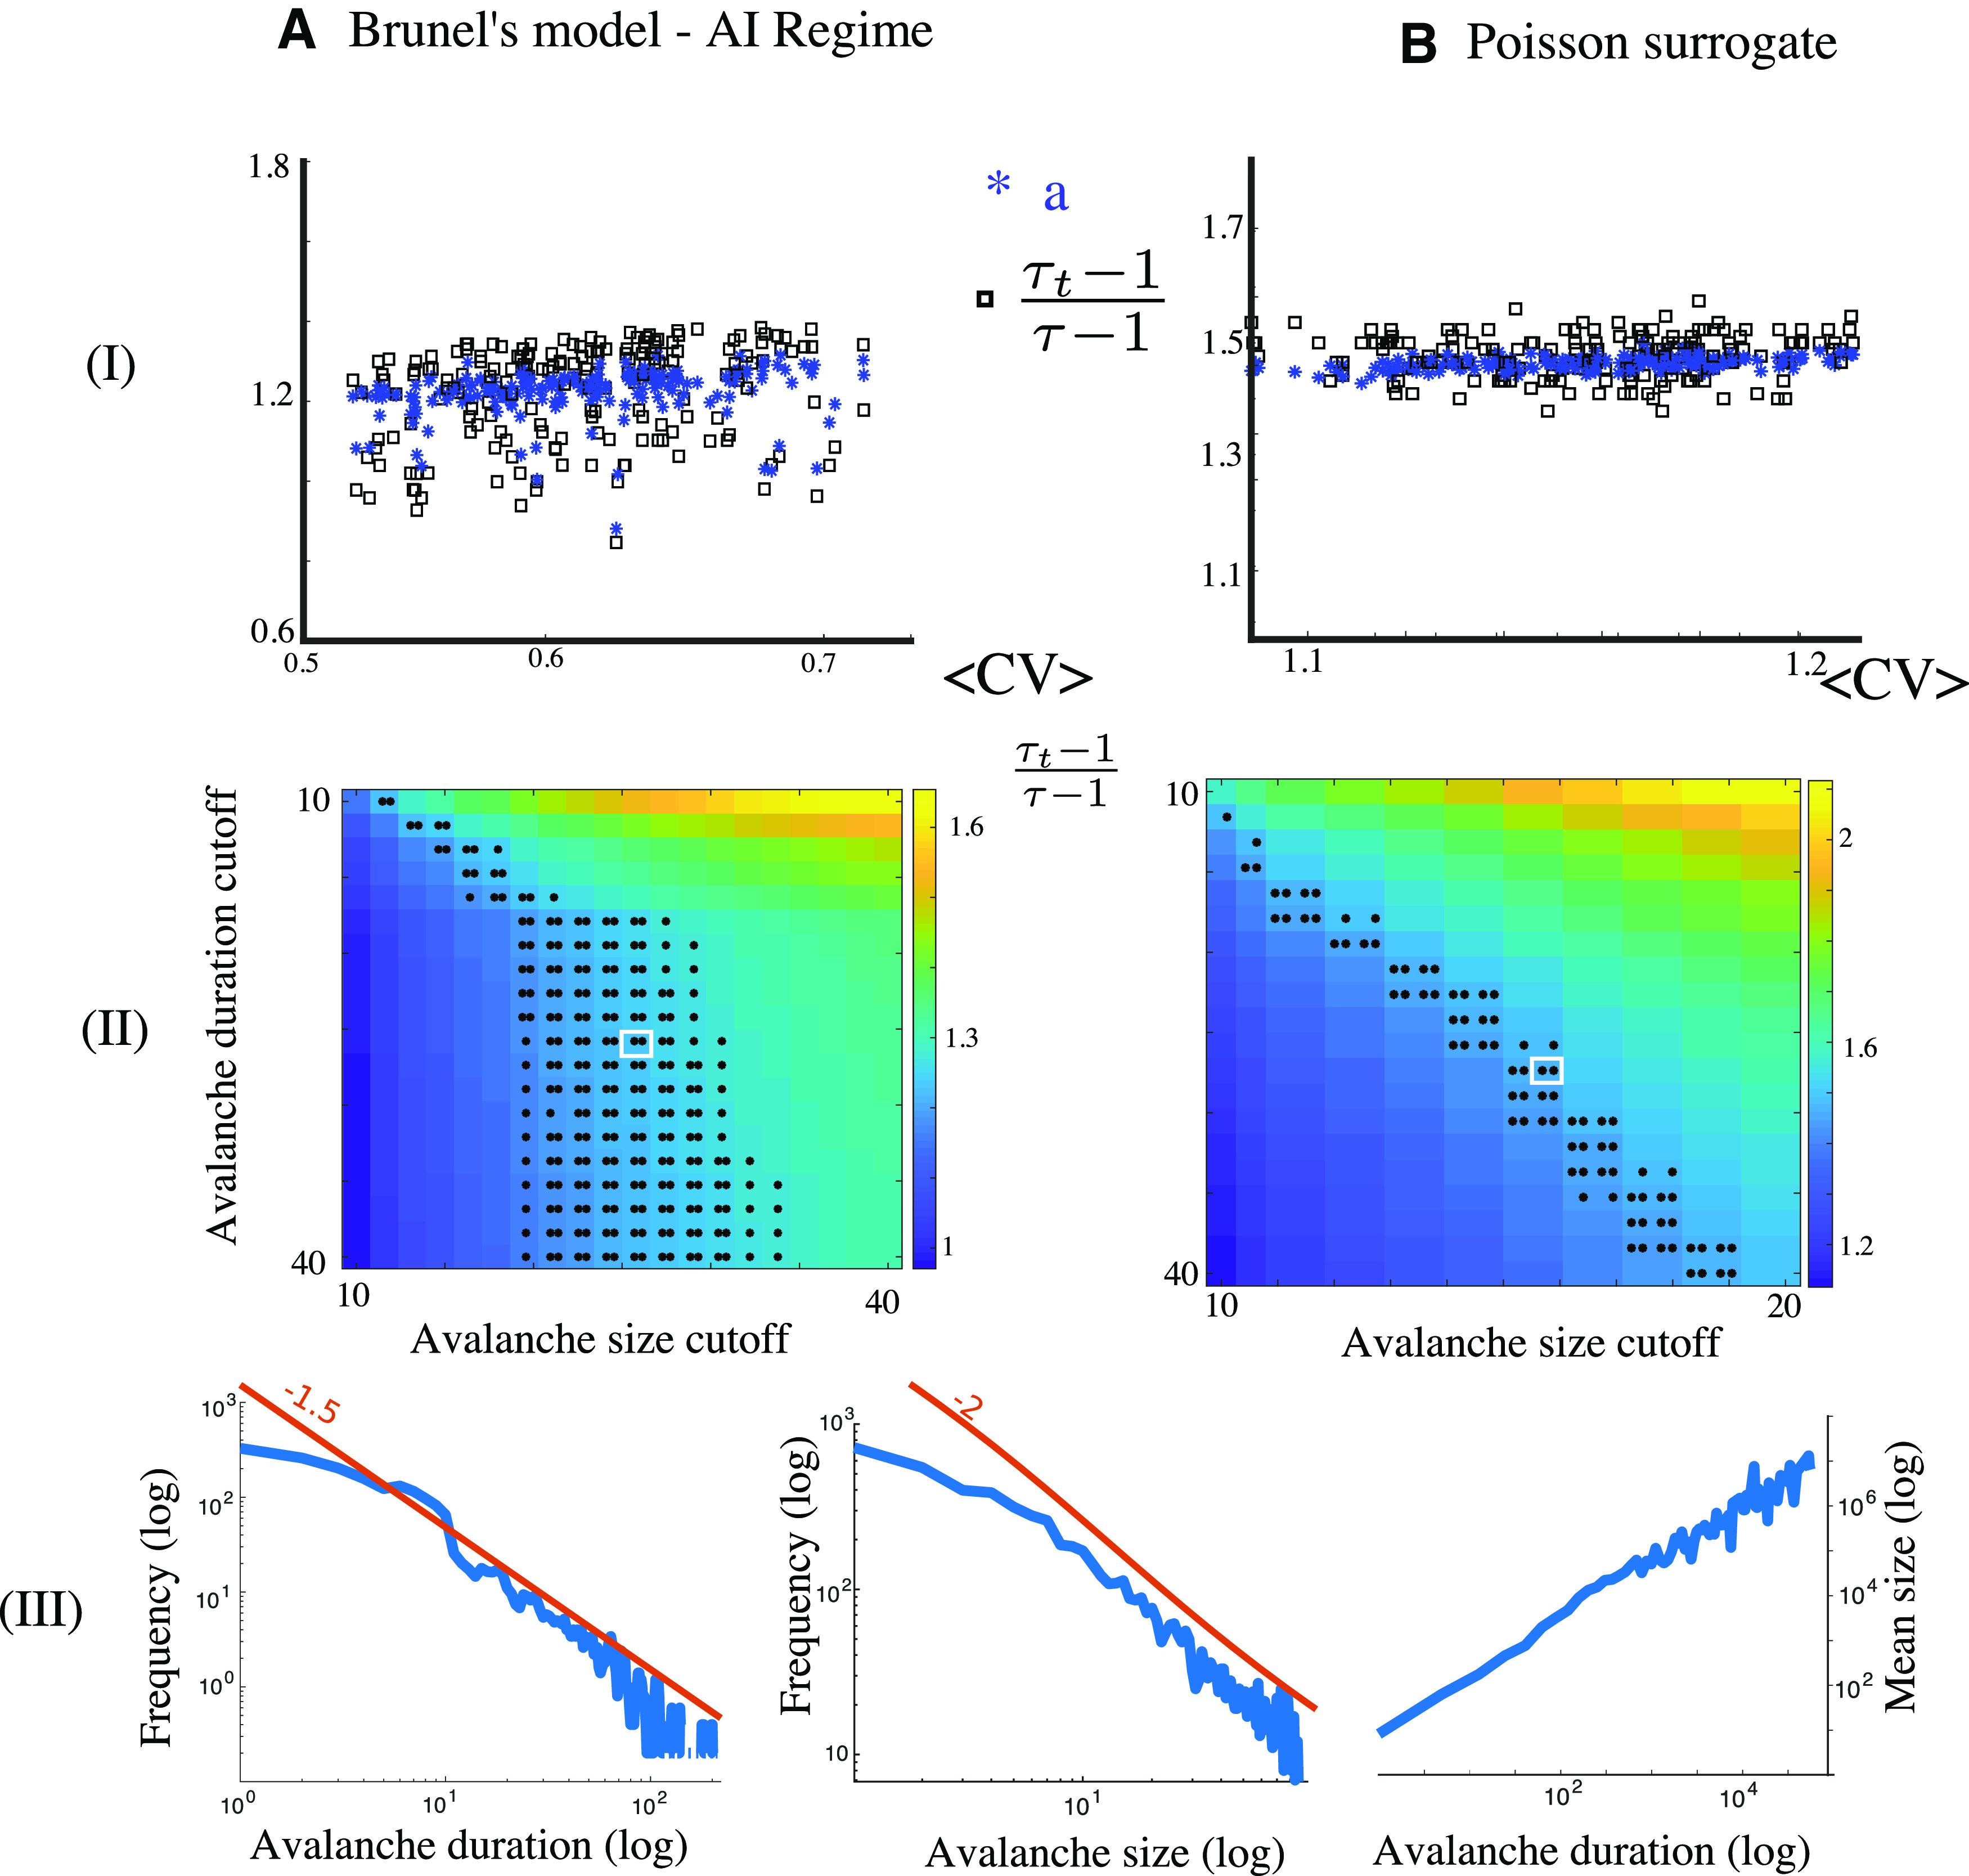
Figure 1.

A total of 200 simulations of the Brunel model (A, left, parameters as in Touboul and Destexhe, 2017, Fig. 7) and Poisson surrogate (B, right, Ornstein–Uhlenbeck rate with randomly chosen coefficients). Top row (I), Two examples of networks classified as critical by the criteria in Fontenele et al. (2019). Middle (II), A multitude of combinations of cutoffs yield results compatible with Sethna’s relationship (two-sample t test, MATLAB function ttest2, comparing the distribution of ratios and a, *p < 0.01, **p < 0.05, for n = 14 instances as in Fontenele et al., 2019). Bottom (III), Example of distributions of avalanche durations (left), size (middle), or average size versus duration in logarithmic scale, used to obtain the statistics in I, II, compare to Fontenele et al. (2019; their Figs. 1F,G, 2C).
