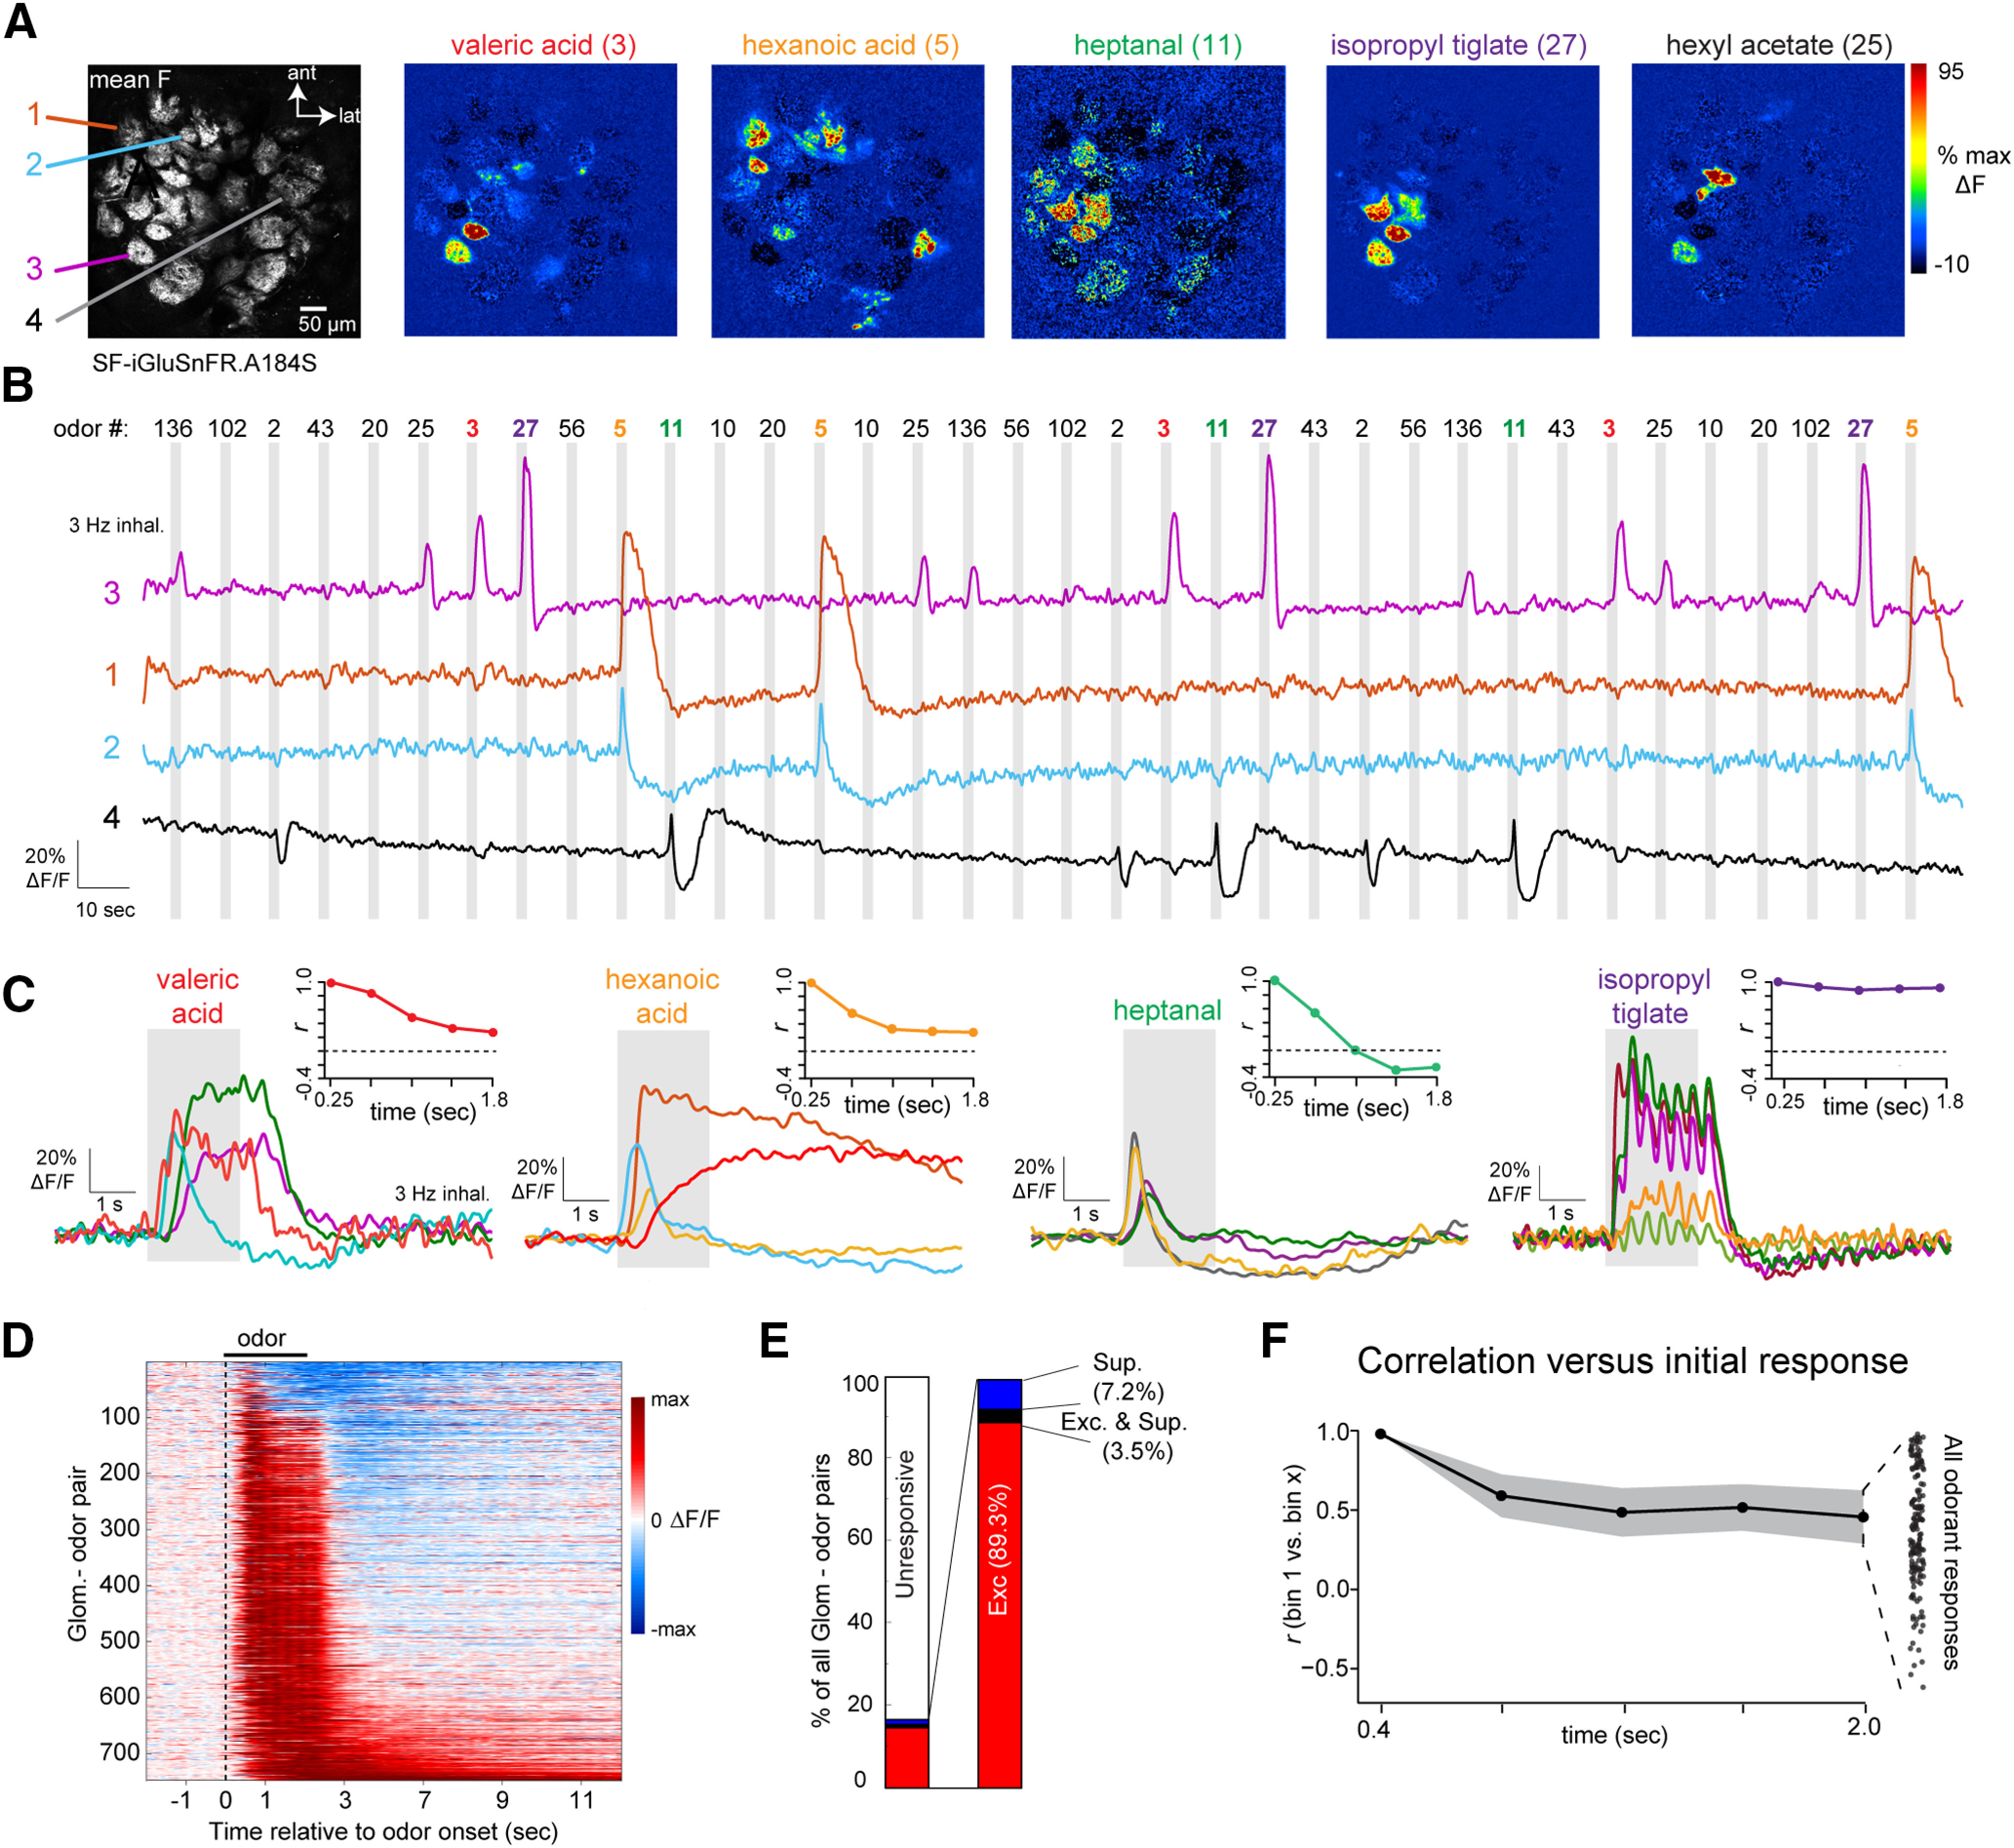
Figure 3.

Glomerular glutamate signals show diverse temporal patterns across repeated inhalations of odorant. A, Mean fluorescence (left) and ΔF response maps for five odorants imaged with SF-iGluSnFR.A184S (right). Odor numbers on the left side of the odorant map indicate odorant identification code for listed odor name (for reference to B). Colored text indicates odorants whose responses are shown in panels B, C, F. B, Time series of SF-iGluSnFR.A184S signal from four glomeruli, showing continuous signal during three repetitions of 12 odorants, presented in random order. Shaded rectangle indicates time of odorant presentations (2-s duration). Signal is low-pass filtered at 0.5 Hz for display. C, Average time course of odorant-evoked responses in different glomeruli responsive to four of the 12 odorants from B. Insets show change in response pattern across the field of view from A over the duration of odorant presentation, expressed as Pearson’s r relative to the initial response in successive time bins of 387 ms (see text). Dotted line indicates r = 0. D, Waterfall plot showing time course of odorant-evoked SF-iGluSnFR.A184S signal in all significantly-responding glomerulus-odor pairs (one pair per row), normalized to the peak ΔF/F for each pair. Suppressive responses are low-pass filtered at 0.5 Hz, and excitatory responses are low pass filtered at 2 Hz. E, Proportion of excitatory (Exc.), suppressive (Sup) and biphasic (Exc. and Sup.) responses across the responsive population (right), as well as the entire population of glomeruli (left). F, Change in glutamate response patterns during odorant presentation, summarized over all presentations. Black plot shows mean correlation over time, averaged across all odorant presentations. Shaded area indicates SEM. Dot plot at right shows correlation coefficients at the final time bin for all presentations.
