Figure 4.

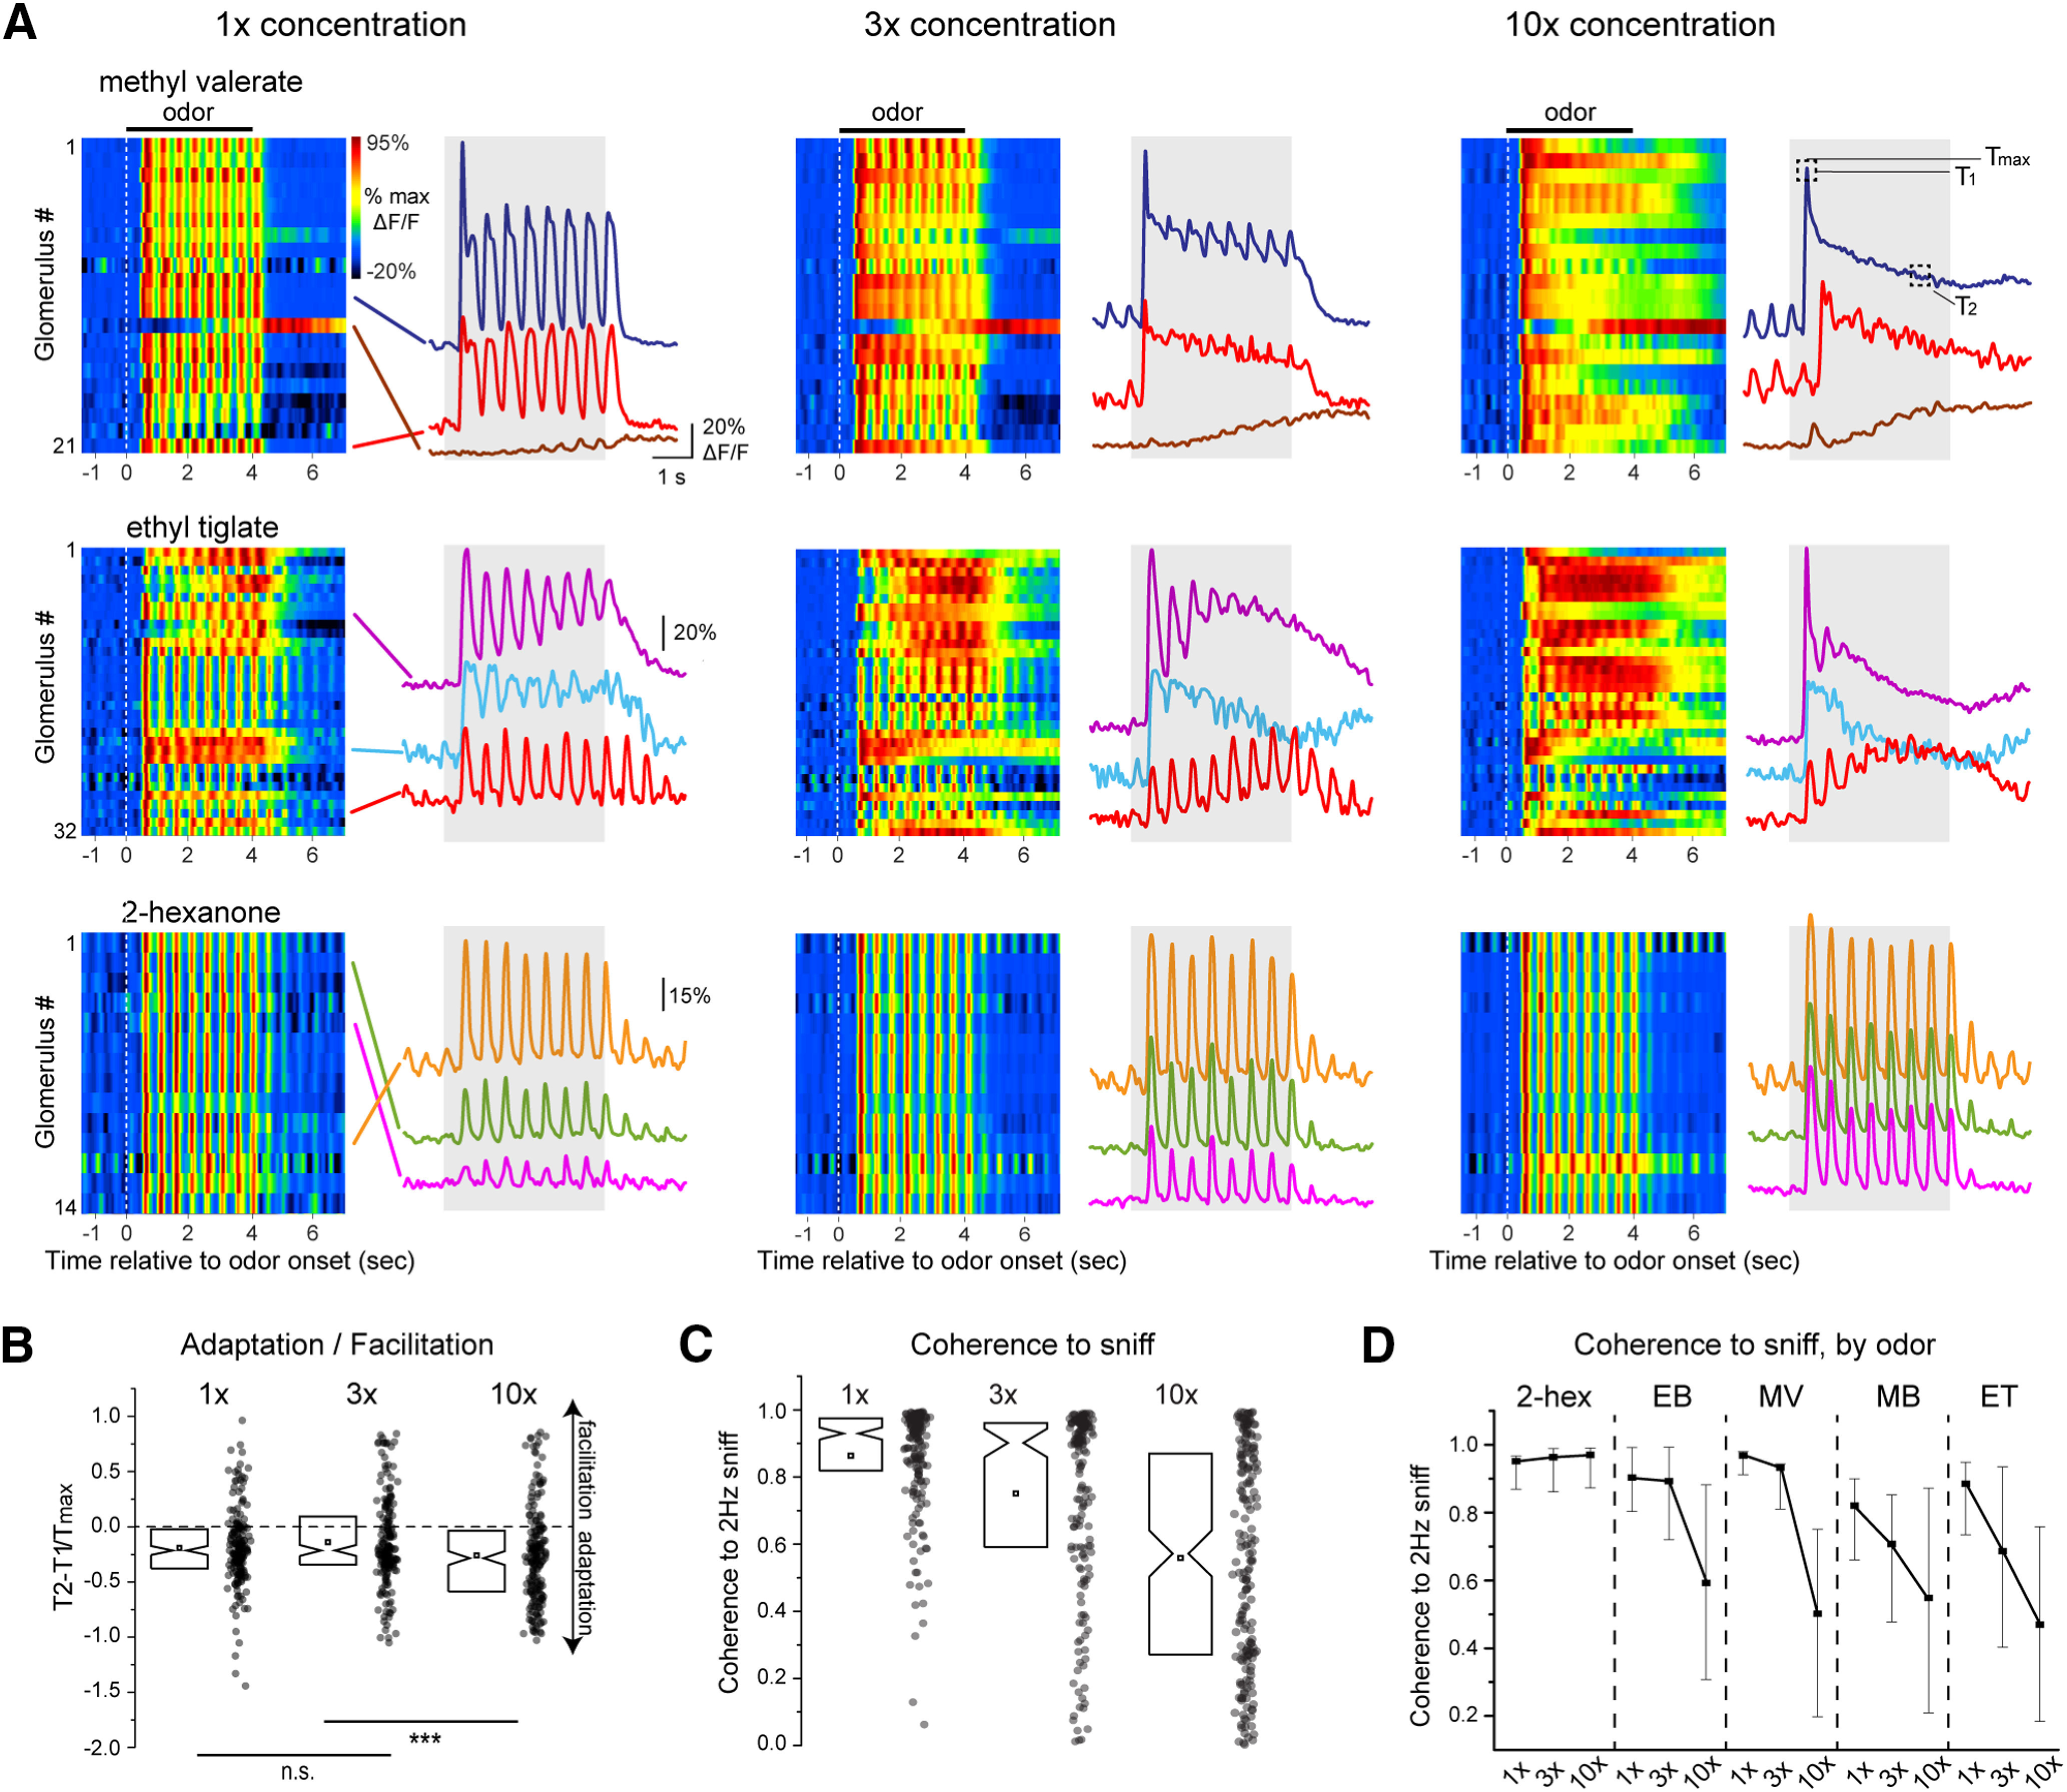
Odorant concentration systematically impacts glutamate signaling onto MT cells. A, Waterfall plots (left) and traces (right) showing time course from select glomeruli showing original iGluSnFR signals in response to three concentrations of odorant for three different odorants (1×, 3×, 10× indicate relative concentration values; see text). All data are from the same experiment and field of view. Only glomeruli showing significant responses at all three concentrations are shown. Inhalation frequency, 2 Hz; odorant duration, 4 s. Signals are unfiltered. Glomerular identity is color coded with lines pointing to the traces. White dotted line indicates odor onset. T1, T2, Tmax (10×, methyl valerate panel) indicates time points used for T2–T1/Tmax measurements in B. B, Change in iGluSnFR response amplitude from beginning to end of odorant presentation (T2–T1/Tmax; see text), summarized for all analyzed glomerulus-odorant pairs (n = 189 glomerulus-odorant pairs from 4 mice). Notch: median, square: mean, box edges: 25th and 75th percentiles. Note high variability and slight but significant trend toward adaptation at all concentrations [one sample t test comparing T2–T1/Tmax; to zero, 1×: −0.19 ± 0.35 (mean ± SD), p = 2 × 10⁻¹², 3×: −0.14 ± 0.40, p = 5 × 10⁻⁶, 10×: −0.26 ± 0.44, p = 8 × 10⁻¹⁴, n = 189 glomerulus-odorant pairs]. Lower bars indicate paired t tests between concentrations; ***p < 0.001; n.s., not significant. C, Coherence of iGluSnFR signal to the 2-Hz inhalation frequency (see text), measured for the same glomerulus-odorant pairs in B, showing high variability across glomeruli and a decrease in coherence at higher concentrations. D, Coherence values as a function of concentration, showing a significant effect of odorant on concentration-coherence functions. Dot: median, error bars: quartiles.
